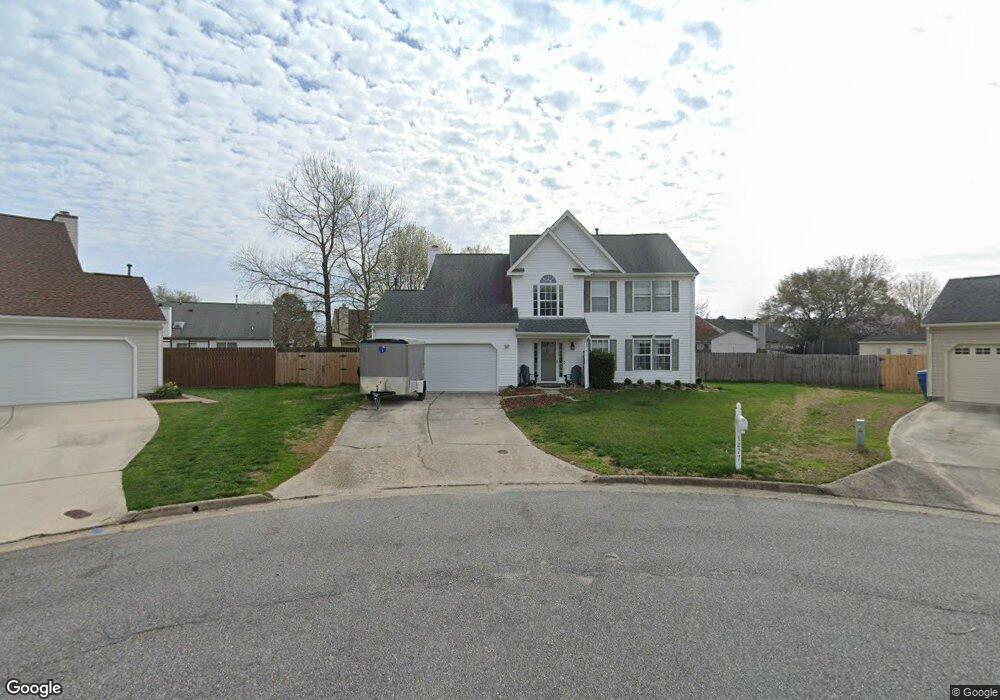
1277 Kasba Ct Virginia Beach, VA 23464
Estimated Value: $457,000 - $514,000
4
Beds
3
Baths
2,300
Sq Ft
$214/Sq Ft
Est. Value
About This Home
This home is located at 1277 Kasba Ct, Virginia Beach, VA 23464 and is currently estimated at $491,700, approximately $213 per square foot. 1277 Kasba Ct is a home located in Virginia Beach City with nearby schools including Glenwood Elementary School, Salem Middle School, and Salem High School.
Ownership History
Date
Name
Owned For
Owner Type
Purchase Details
Closed on
Aug 27, 2020
Sold by
Carr Travis N and Mcdonald Carr Junita
Bought by
Paulmino Christopher Andy F and Paulmino Melissa D
Current Estimated Value
Home Financials for this Owner
Home Financials are based on the most recent Mortgage that was taken out on this home.
Original Mortgage
$324,288
Outstanding Balance
$287,666
Interest Rate
3%
Mortgage Type
New Conventional
Estimated Equity
$204,034
Purchase Details
Closed on
Mar 29, 2010
Sold by
Bachman Glen A
Bought by
Carr Travis N
Home Financials for this Owner
Home Financials are based on the most recent Mortgage that was taken out on this home.
Original Mortgage
$318,621
Interest Rate
5.5%
Mortgage Type
FHA
Purchase Details
Closed on
Mar 3, 2003
Sold by
Matherne David J
Bought by
Bachman Glen A
Home Financials for this Owner
Home Financials are based on the most recent Mortgage that was taken out on this home.
Original Mortgage
$183,600
Interest Rate
5.98%
Mortgage Type
VA
Create a Home Valuation Report for This Property
The Home Valuation Report is an in-depth analysis detailing your home's value as well as a comparison with similar homes in the area
Home Values in the Area
Average Home Value in this Area
Purchase History
| Date | Buyer | Sale Price | Title Company |
|---|---|---|---|
| Paulmino Christopher Andy F | $360,000 | Fidelity National Ttl Ins Co | |
| Carr Travis N | $324,500 | -- | |
| Bachman Glen A | $180,000 | -- |
Source: Public Records
Mortgage History
| Date | Status | Borrower | Loan Amount |
|---|---|---|---|
| Open | Paulmino Christopher Andy F | $324,288 | |
| Previous Owner | Carr Travis N | $318,621 | |
| Previous Owner | Bachman Glen A | $183,600 |
Source: Public Records
Tax History Compared to Growth
Tax History
| Year | Tax Paid | Tax Assessment Tax Assessment Total Assessment is a certain percentage of the fair market value that is determined by local assessors to be the total taxable value of land and additions on the property. | Land | Improvement |
|---|---|---|---|---|
| 2025 | $4,018 | $433,100 | $170,000 | $263,100 |
| 2024 | $4,018 | $414,200 | $160,000 | $254,200 |
| 2023 | $3,953 | $399,300 | $135,000 | $264,300 |
| 2022 | $3,550 | $358,600 | $115,500 | $243,100 |
| 2021 | $3,236 | $326,900 | $105,000 | $221,900 |
| 2020 | $3,076 | $302,300 | $95,000 | $207,300 |
| 2019 | $3,009 | $290,100 | $93,000 | $197,100 |
| 2018 | $2,908 | $290,100 | $93,000 | $197,100 |
| 2017 | $2,902 | $289,500 | $91,000 | $198,500 |
| 2016 | $2,773 | $280,100 | $89,000 | $191,100 |
| 2015 | $2,625 | $265,200 | $85,000 | $180,200 |
| 2014 | $2,382 | $255,200 | $105,000 | $150,200 |
Source: Public Records
Map
Nearby Homes
- 1232 Northvale Dr
- 2148 Dove Ridge Dr
- 1936 Southaven Dr
- 2017 Southaven Dr
- 1981 Gravenhurst Dr
- 1341 Sagamore Ct
- 2008 Hopi Ct
- 1292 Raynor Dr
- 1536 Drumheller Dr
- 2020 Lyndora Rd
- 2100 Rydale Ct
- 1421 Eddystone Dr Unit X9192
- 2708 Ada Arch
- 1912 Bunnell Ct
- 4740 Kilby Dr Unit 10
- 1445 Marmora Rd
- 4660 Indian River Rd
- 4668 Indian River Rd
- 1324 Hafford Rd
- 940 Summerside Ct
- 1281 Kasba Ct
- 2052 Dove View Dr
- 2048 Dove View Dr
- 2044 Dove View Dr
- 1276 Kasba Ct
- 1285 Kasba Ct
- 2040 Dove View Dr
- 2060 Dove View Dr
- 1280 Kasba Ct
- 2064 Dove View Dr
- 1284 Kasba Ct
- 3956 Pleasant Valley Rd
- 3976 Pleasant Valley Rd
- 3964 Pleasant Valley Rd
- 3980 Pleasant Valley Rd
- 2036 Dove View Dr
- 1289 Kasba Ct
- 3984 Pleasant Valley Rd
- 1196 Dovetail Ct
- 1197 Dovetail Ct