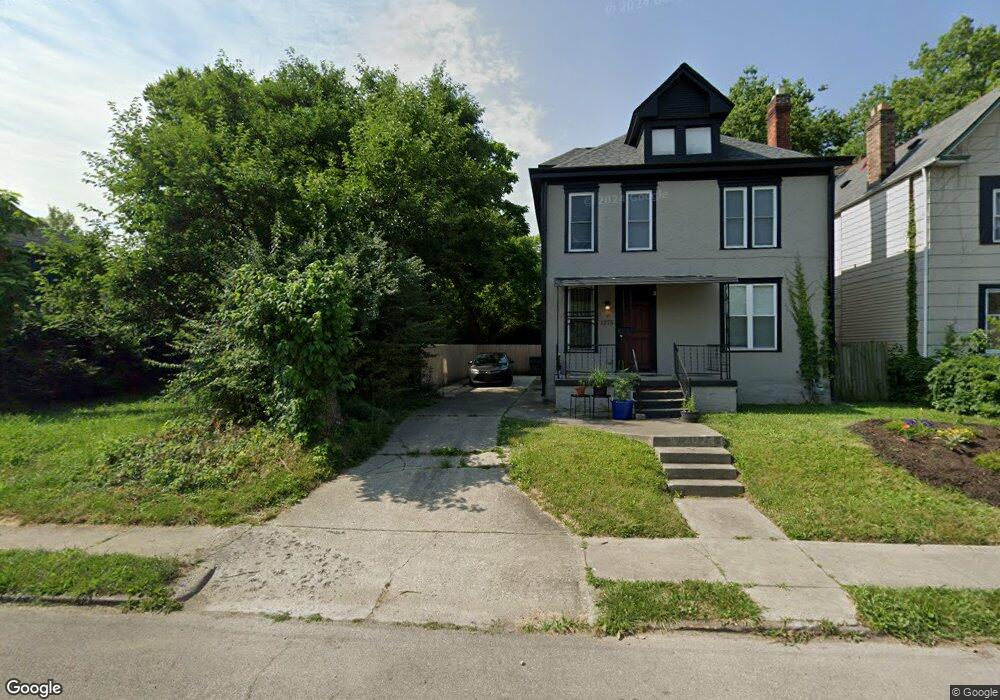
1277 Mooberry St Columbus, OH 43205
Livingston Park NeighborhoodEstimated Value: $57,000 - $880,000
6
Beds
2
Baths
2,280
Sq Ft
$167/Sq Ft
Est. Value
About This Home
This home is located at 1277 Mooberry St, Columbus, OH 43205 and is currently estimated at $381,000, approximately $167 per square foot. 1277 Mooberry St is a home located in Franklin County with nearby schools including Livingston Elementary School, South High School, and Capital Collegiate Preparatory Academy.
Ownership History
Date
Name
Owned For
Owner Type
Purchase Details
Closed on
Feb 22, 2019
Sold by
473 Hinman Llc
Bought by
Abreha Selemon
Current Estimated Value
Purchase Details
Closed on
Jan 12, 2018
Sold by
Fawcett David B
Bought by
473 Hinman Llc
Purchase Details
Closed on
Oct 27, 2017
Sold by
Old Oaks Civic Assocaiton
Bought by
Faweet David B and The David B Faweet Trust
Purchase Details
Closed on
May 6, 2003
Sold by
Columbus Housing Partnership Inc
Bought by
Old Oaks Civic Assn
Purchase Details
Closed on
Nov 16, 2000
Sold by
Payne Eula A
Bought by
South East Columbus Homes Ltd Partnershi
Purchase Details
Closed on
May 28, 1999
Sold by
Payne Donald A and Payne Denise A
Bought by
Payne Eula A
Purchase Details
Closed on
Sep 1, 1989
Bought by
Payne Donald A
Purchase Details
Closed on
Apr 1, 1987
Purchase Details
Closed on
Apr 1, 1985
Create a Home Valuation Report for This Property
The Home Valuation Report is an in-depth analysis detailing your home's value as well as a comparison with similar homes in the area
Home Values in the Area
Average Home Value in this Area
Purchase History
| Date | Buyer | Sale Price | Title Company |
|---|---|---|---|
| Abreha Selemon | $25,000 | Pm Title Box | |
| 473 Hinman Llc | $21,000 | None Available | |
| Faweet David B | $1,590,000 | None Available | |
| Old Oaks Civic Assn | $40,000 | -- | |
| South East Columbus Homes Ltd Partnershi | $2,500 | Connor Title Co | |
| Payne Eula A | -- | Horizon Title | |
| Payne Donald A | -- | -- | |
| -- | -- | -- | |
| -- | $35,000 | -- |
Source: Public Records
Tax History Compared to Growth
Tax History
| Year | Tax Paid | Tax Assessment Tax Assessment Total Assessment is a certain percentage of the fair market value that is determined by local assessors to be the total taxable value of land and additions on the property. | Land | Improvement |
|---|---|---|---|---|
| 2024 | $4,784 | $35,490 | $35,490 | -- |
| 2023 | $3,173 | $35,490 | $35,490 | $0 |
| 2022 | $2,717 | $7,250 | $7,250 | $0 |
| 2021 | $1,823 | $7,250 | $7,250 | $0 |
| 2020 | $983 | $7,250 | $7,250 | $0 |
| 2019 | $346 | $5,570 | $5,570 | $0 |
| 2018 | $276 | $5,570 | $5,570 | $0 |
| 2017 | $286 | $5,570 | $5,570 | $0 |
| 2016 | $226 | $3,330 | $3,330 | $0 |
| 2015 | $206 | $3,330 | $3,330 | $0 |
| 2014 | $206 | $3,330 | $3,330 | $0 |
| 2013 | $107 | $3,500 | $3,500 | $0 |
Source: Public Records
Map
Nearby Homes
- 0 Mooberry St
- 1339 Mooberry St
- 1328 Kent St
- 572 Linwood Ave
- 568-570 Kimball Place
- 668 Wilson Ave
- 0 E Fulton St
- 532 Linwood Ave Unit 34
- 734 Linwood Ave
- 1342 E Fulton St
- 1364 E Fulton St Unit 366
- 693 Wilson Ave
- 1186-1188 E Livingston Ave Unit 1186
- 693 Kelton Ave
- 653 Oakwood Ave
- 829-831 Studer Ave
- 640 S Champion Ave Unit 644
- 1468 E Fulton St
- 1157 E Livingston Ave
- 711 Oakwood Ave
- 1277 Mooberry St Unit 279
- 1279 Mooberry St
- 1279 Mooberry St Unit 81
- 1287 Mooberry St
- 1272 Kent St
- 1275 Mooberry St
- 1291 Mooberry St
- 655 Kimball Place
- 1269 Mooberry St
- 1265 Mooberry St
- 664 Bedford Ave Unit 11B
- 664 Bedford Ave Unit 666
- 664-666 Bedford Ave
- 1261 Mooberry St
- 1289 Kent St
- 1255 Mooberry St
- 670 Bedford Ave
- 671 Kimball Place Unit 673
- 671-673 Kimball Place
- 665 Bedford Ave