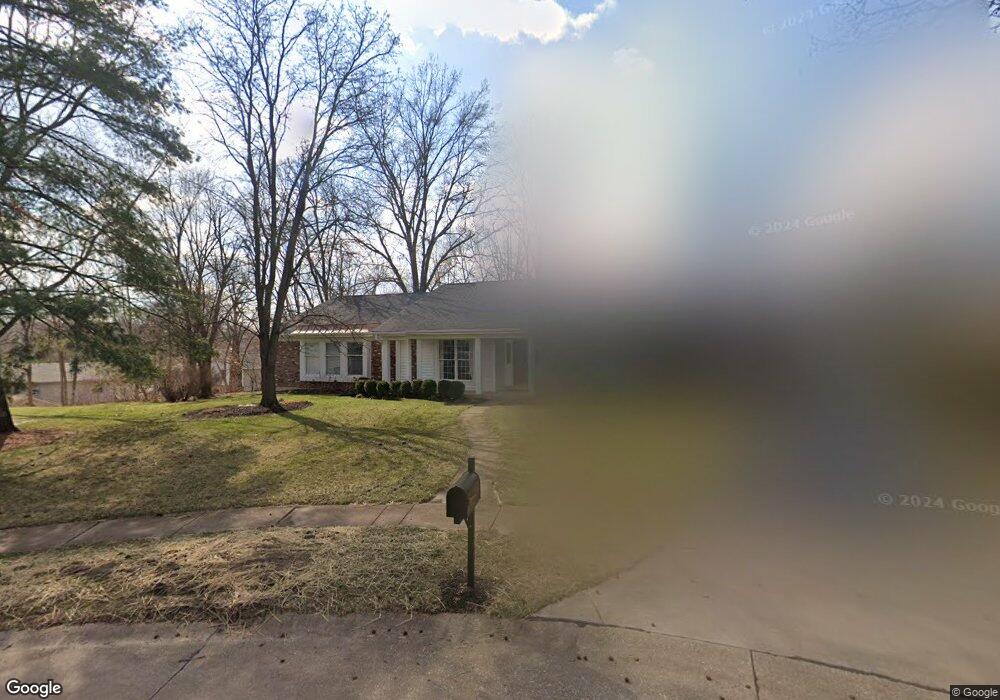
1277 Rogue River Ct Chesterfield, MO 63017
Estimated Value: $481,762 - $562,000
3
Beds
2
Baths
2,220
Sq Ft
$235/Sq Ft
Est. Value
About This Home
This home is located at 1277 Rogue River Ct, Chesterfield, MO 63017 and is currently estimated at $522,691, approximately $235 per square foot. 1277 Rogue River Ct is a home located in St. Louis County with nearby schools including Shenandoah Valley Elementary, Parkway Central Middle School, and Parkway Central High School.
Ownership History
Date
Name
Owned For
Owner Type
Purchase Details
Closed on
Jan 24, 2017
Sold by
Bredbenner Craig D and Bredbenner Melissa J
Bought by
Bredbenner Craig D
Current Estimated Value
Purchase Details
Closed on
Aug 11, 2005
Sold by
Bredbenner Craig D and Bredbenner Melissa J
Bought by
Bredbenner Craig D and Bredbenner Melissa J
Home Financials for this Owner
Home Financials are based on the most recent Mortgage that was taken out on this home.
Original Mortgage
$227,000
Outstanding Balance
$112,202
Interest Rate
4.75%
Mortgage Type
Stand Alone Refi Refinance Of Original Loan
Estimated Equity
$410,489
Purchase Details
Closed on
Mar 24, 2005
Sold by
Tierney Mary Patricia
Bought by
Bredbenner Craig D
Home Financials for this Owner
Home Financials are based on the most recent Mortgage that was taken out on this home.
Original Mortgage
$225,000
Interest Rate
5.71%
Mortgage Type
Purchase Money Mortgage
Purchase Details
Closed on
Sep 14, 2004
Sold by
Kelley Mary Ann
Bought by
Tierney Mary Patricia and Edward Jones Trust Co
Create a Home Valuation Report for This Property
The Home Valuation Report is an in-depth analysis detailing your home's value as well as a comparison with similar homes in the area
Home Values in the Area
Average Home Value in this Area
Purchase History
| Date | Buyer | Sale Price | Title Company |
|---|---|---|---|
| Bredbenner Craig D | -- | None Available | |
| Bredbenner Craig D | -- | -- | |
| Bredbenner Craig D | $282,000 | -- | |
| Tierney Mary Patricia | -- | -- |
Source: Public Records
Mortgage History
| Date | Status | Borrower | Loan Amount |
|---|---|---|---|
| Open | Bredbenner Craig D | $227,000 | |
| Closed | Bredbenner Craig D | $225,000 |
Source: Public Records
Tax History Compared to Growth
Tax History
| Year | Tax Paid | Tax Assessment Tax Assessment Total Assessment is a certain percentage of the fair market value that is determined by local assessors to be the total taxable value of land and additions on the property. | Land | Improvement |
|---|---|---|---|---|
| 2025 | $5,119 | $90,390 | $49,650 | $40,740 |
| 2024 | $5,119 | $77,380 | $27,490 | $49,890 |
| 2023 | $4,910 | $77,380 | $27,490 | $49,890 |
| 2022 | $4,713 | $67,580 | $27,490 | $40,090 |
| 2021 | $4,694 | $67,580 | $27,490 | $40,090 |
| 2020 | $4,607 | $63,700 | $23,290 | $40,410 |
| 2019 | $4,507 | $63,700 | $23,290 | $40,410 |
| 2018 | $4,311 | $56,500 | $23,290 | $33,210 |
| 2017 | $4,194 | $56,500 | $23,290 | $33,210 |
| 2016 | $4,170 | $53,390 | $17,670 | $35,720 |
| 2015 | $4,372 | $53,390 | $17,670 | $35,720 |
| 2014 | $3,761 | $49,080 | $11,420 | $37,660 |
Source: Public Records
Map
Nearby Homes
- 14616 Rogue River Dr
- 384 Greentrails Dr S
- 15261 Springrun Dr
- 14424 Valley Meadow Ct W
- 14361 White Birch Valley Ln
- 1226 Luray Dr
- 1251 Still House Creek Rd
- 14144 Baywood Villages Dr
- 14300 Conway Meadows Ct E Unit 302
- 15324 Appalachian Trail
- 314 Valley Forge Ct
- 240 Greentrails Dr S
- 14629 Timberlake Manor Ct
- 1237 Cedar Creek Rd
- 1123 Cabinview Ct
- 14663 Mallard Lake Dr
- 1507 Timberlake Manor Pkwy
- 14560 White Birch Valley Ln
- 722 Walnut Creek Ln
- 1110 Nooning Tree Dr
- 1283 Rogue River Ct
- 1273 Rogue River Ct
- 1276 Winema Dr
- 1280 Winema Dr
- 14565 Appalachian Trail
- 1272 Winema Dr
- 14575 Appalachian Trail
- 14557 Appalachian Trail
- 1269 Rogue River Ct
- 1282 Rogue River Ct
- 14583 Appalachian Trail
- 1278 Rogue River Ct
- 1268 Winema Dr
- 14545 Appalachian Trail
- 1274 Rogue River Ct
- 1265 Rogue River Ct
- 14720 Plumas Dr
- 1271 Winema Dr
- 1264 Winema Dr
- 14576 Appalachian Trail