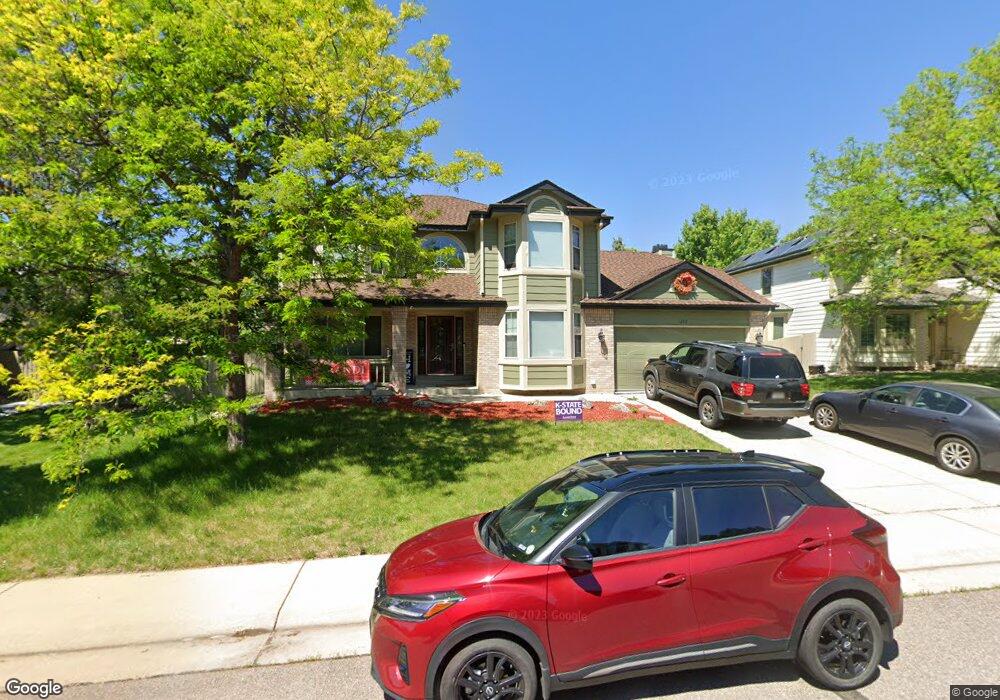
1277 S Mesa Ct Superior, CO 80027
Estimated Value: $828,000 - $985,000
4
Beds
3
Baths
2,322
Sq Ft
$381/Sq Ft
Est. Value
About This Home
This home is located at 1277 S Mesa Ct, Superior, CO 80027 and is currently estimated at $884,483, approximately $380 per square foot. 1277 S Mesa Ct is a home located in Boulder County with nearby schools including Eldorado K-8 School, Superior Elementary School, and Monarch High School.
Ownership History
Date
Name
Owned For
Owner Type
Purchase Details
Closed on
Mar 1, 2017
Sold by
Price Charles D
Bought by
Price Charles D
Current Estimated Value
Home Financials for this Owner
Home Financials are based on the most recent Mortgage that was taken out on this home.
Original Mortgage
$495,840
Outstanding Balance
$411,405
Interest Rate
4.19%
Mortgage Type
VA
Estimated Equity
$473,078
Purchase Details
Closed on
Jan 12, 2004
Sold by
Price Charles D and Price Rosemarie B
Bought by
Price Charles D
Home Financials for this Owner
Home Financials are based on the most recent Mortgage that was taken out on this home.
Original Mortgage
$354,000
Interest Rate
4.75%
Mortgage Type
Purchase Money Mortgage
Purchase Details
Closed on
Nov 30, 2000
Sold by
Larson Kevin M and Larson Kristen D
Bought by
Price Charles D
Home Financials for this Owner
Home Financials are based on the most recent Mortgage that was taken out on this home.
Original Mortgage
$319,920
Interest Rate
8.48%
Purchase Details
Closed on
Mar 4, 1992
Bought by
Price Charles D
Purchase Details
Closed on
Aug 5, 1991
Bought by
Price Charles D
Purchase Details
Closed on
Jun 26, 1991
Bought by
Price Charles D
Create a Home Valuation Report for This Property
The Home Valuation Report is an in-depth analysis detailing your home's value as well as a comparison with similar homes in the area
Home Values in the Area
Average Home Value in this Area
Purchase History
| Date | Buyer | Sale Price | Title Company |
|---|---|---|---|
| Price Charles D | -- | Navy Federal Title Services | |
| Price Charles D | -- | Land Title Guarantee Company | |
| Price Charles D | $399,900 | -- | |
| Price Charles D | $179,000 | -- | |
| Price Charles D | -- | -- | |
| Price Charles D | -- | -- |
Source: Public Records
Mortgage History
| Date | Status | Borrower | Loan Amount |
|---|---|---|---|
| Open | Price Charles D | $495,840 | |
| Closed | Price Charles D | $354,000 | |
| Closed | Price Charles D | $319,920 |
Source: Public Records
Tax History Compared to Growth
Tax History
| Year | Tax Paid | Tax Assessment Tax Assessment Total Assessment is a certain percentage of the fair market value that is determined by local assessors to be the total taxable value of land and additions on the property. | Land | Improvement |
|---|---|---|---|---|
| 2025 | $5,671 | $54,438 | $28,188 | $26,250 |
| 2024 | $5,671 | $54,438 | $28,188 | $26,250 |
| 2023 | $5,593 | $54,732 | $24,911 | $33,507 |
| 2022 | $4,452 | $42,562 | $19,703 | $22,859 |
| 2021 | $4,754 | $47,083 | $21,793 | $25,290 |
| 2020 | $4,420 | $42,071 | $27,456 | $14,615 |
| 2019 | $4,359 | $42,071 | $27,456 | $14,615 |
| 2018 | $4,156 | $39,737 | $17,280 | $22,457 |
| 2017 | $4,248 | $43,931 | $19,104 | $24,827 |
| 2016 | $4,152 | $37,523 | $17,830 | $19,693 |
| 2015 | $3,946 | $33,544 | $14,567 | $18,977 |
| 2014 | $3,562 | $33,544 | $14,567 | $18,977 |
Source: Public Records
Map
Nearby Homes
- 1340 Stoneham St
- 1485 Stoneham St
- 1220 S Boyero Ct
- 1420 Lanterns Ln
- 725 E Wiggins St
- 948 Promenade Dr
- 1825 Keota Ln
- 2330 Miner Ln
- 2341 Superior Dr
- 818 Promenade Dr
- 2351 Superior Dr
- 1899 Breen Ln
- 1637 Reliance Cir
- 2361 Junegrass Ln
- 1540 Masters Ct
- 730 Promenade Dr
- 1820 Vernon Ln
- 710 Promenade Dr
- 2532 Junegrass Ln
- 860 Josephine Way
- 1257 S Mesa Ct
- 1297 S Mesa Ct
- 1237 S Mesa Ct
- 1260 S Laird Ct
- 1262 S Mesa Ct
- 1282 S Mesa Ct
- 1242 S Mesa Ct
- 1240 S Laird Ct
- 1217 S Mesa Ct
- 1144 E Akron Place
- 1124 E Akron Place
- 1184 E Akron Place
- 1164 E Akron Place
- 1104 E Akron Place
- 1222 S Mesa Ct
- 1220 S Laird Ct
- 1320 S Mesa Ct
- 1079 E Akron Place
- 1335 S Mesa Ct
- 1186 Amherst Way