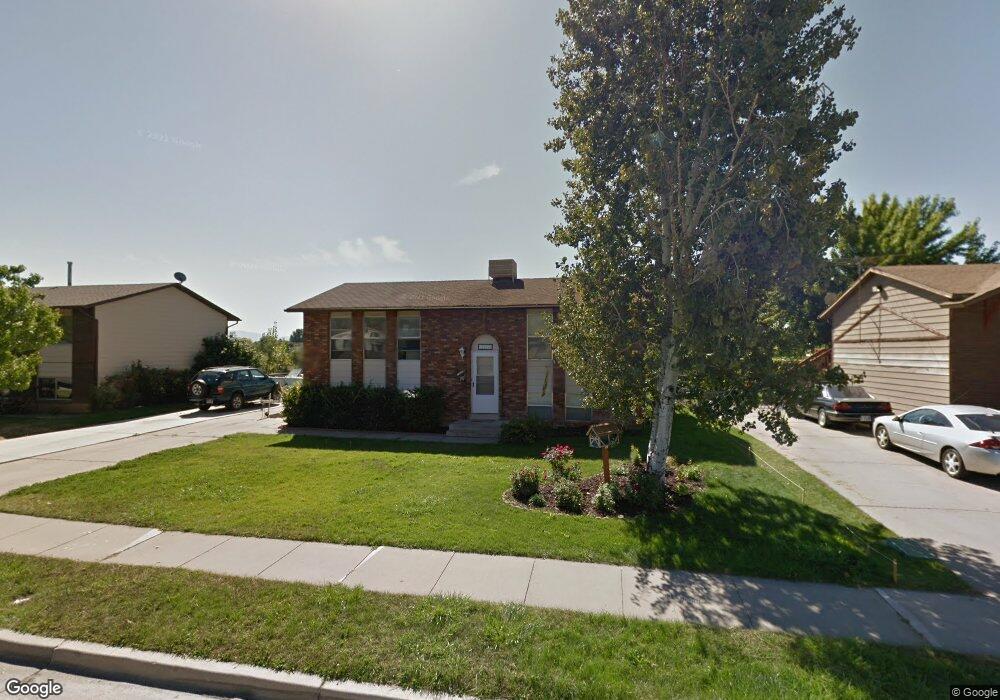
1277 W 1045 S Clearfield, UT 84015
Estimated Value: $400,000 - $422,000
3
Beds
1
Bath
1,960
Sq Ft
$210/Sq Ft
Est. Value
About This Home
This home is located at 1277 W 1045 S, Clearfield, UT 84015 and is currently estimated at $411,210, approximately $209 per square foot. 1277 W 1045 S is a home located in Davis County with nearby schools including Cook School, Syracuse Junior High School, and Syracuse High School.
Ownership History
Date
Name
Owned For
Owner Type
Purchase Details
Closed on
Apr 27, 2001
Sold by
Leavitt Mathew
Bought by
Green Jim and Green Vickie
Current Estimated Value
Home Financials for this Owner
Home Financials are based on the most recent Mortgage that was taken out on this home.
Original Mortgage
$112,140
Outstanding Balance
$41,216
Interest Rate
6.98%
Estimated Equity
$369,994
Purchase Details
Closed on
Apr 26, 2001
Sold by
Shepherd Scott R
Bought by
Leavitt Mathew
Home Financials for this Owner
Home Financials are based on the most recent Mortgage that was taken out on this home.
Original Mortgage
$112,140
Outstanding Balance
$41,216
Interest Rate
6.98%
Estimated Equity
$369,994
Purchase Details
Closed on
Mar 21, 2001
Sold by
Cummings Douglas William and Cummings Cindy Bosch
Bought by
Shepherd Scott R
Home Financials for this Owner
Home Financials are based on the most recent Mortgage that was taken out on this home.
Original Mortgage
$112,140
Outstanding Balance
$41,216
Interest Rate
6.98%
Estimated Equity
$369,994
Create a Home Valuation Report for This Property
The Home Valuation Report is an in-depth analysis detailing your home's value as well as a comparison with similar homes in the area
Home Values in the Area
Average Home Value in this Area
Purchase History
| Date | Buyer | Sale Price | Title Company |
|---|---|---|---|
| Green Jim | -- | Bonneville Title Company Inc | |
| Leavitt Mathew | -- | Bonneville Title Company Inc | |
| Shepherd Scott R | -- | Bonneville Title Company Inc |
Source: Public Records
Mortgage History
| Date | Status | Borrower | Loan Amount |
|---|---|---|---|
| Open | Green Jim | $112,140 |
Source: Public Records
Tax History Compared to Growth
Tax History
| Year | Tax Paid | Tax Assessment Tax Assessment Total Assessment is a certain percentage of the fair market value that is determined by local assessors to be the total taxable value of land and additions on the property. | Land | Improvement |
|---|---|---|---|---|
| 2025 | $2,087 | $187,000 | $73,665 | $113,335 |
| 2024 | $2,023 | $182,600 | $70,417 | $112,183 |
| 2023 | $1,877 | $311,000 | $112,552 | $198,448 |
| 2022 | $1,964 | $176,000 | $64,333 | $111,667 |
| 2021 | $1,773 | $240,000 | $69,058 | $170,942 |
| 2020 | $1,547 | $208,000 | $58,200 | $149,800 |
| 2019 | $1,507 | $200,000 | $60,541 | $139,459 |
| 2018 | $1,361 | $176,000 | $53,736 | $122,264 |
| 2016 | $1,162 | $78,540 | $21,509 | $57,031 |
| 2015 | $1,111 | $71,610 | $21,509 | $50,101 |
| 2014 | $1,011 | $66,026 | $21,509 | $44,517 |
| 2013 | -- | $68,631 | $32,670 | $35,961 |
Source: Public Records
Map
Nearby Homes
- 1166 Dallas St
- 817 S 1350 W
- 1121 W 1290 S
- 1097 W 850 S
- 1384 S Melanie Ln
- 1251 S 1650 W
- 1385 S 1100 W
- 1327 S 1650 W
- 1481 S Melanie Ln
- 922 S 1760 W
- 587 S 1400 W
- 916 S 1760 W
- 1466 Earl Cir
- 1154 W 1700 S
- 1622 S 1000 W
- 1876 S 1230 W
- 4284 W 350 S Unit 615
- 4296 W 350 S Unit 614
- 1153 W 1875 S Unit 223
- 2117 W 1275 S
- 1299 W 1045 S
- 1251 W 1045 S
- 1274 W 1100 S Unit 106
- 1274 W 1100 S
- 1282 W 1100 S
- 1282 W 1100 S Unit 105
- 1262 W 1100 S Unit 107
- 1309 W 1045 S
- 1243 W 1045 S
- 1280 W 1045 S
- 1260 W 1045 S
- 1254 W 1100 S Unit 108
- 1323 W 1045 S
- 1117 S 1275 W Unit 102
- 1117 S 1275 W Unit 104
- 1242 W 1100 S
- 1231 W 1045 S
- 1104 S 1325 W
- 1104 S 1325 W Unit 24
- 1328 W 1100 S