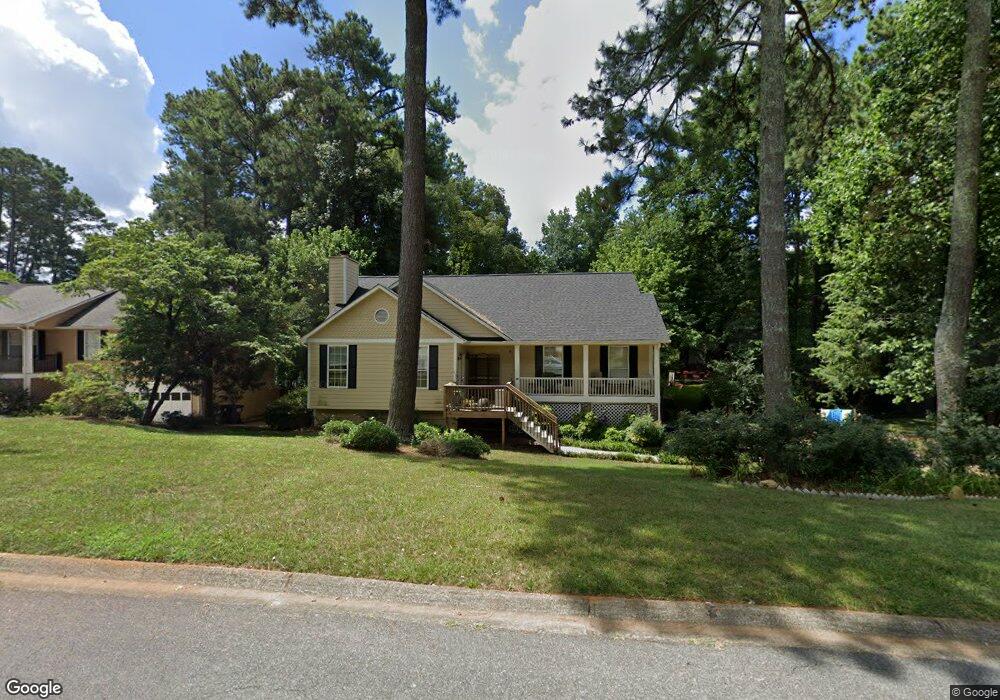
1277 Westover Trace NW Acworth, GA 30102
Estimated Value: $390,094 - $415,000
4
Beds
3
Baths
2,527
Sq Ft
$157/Sq Ft
Est. Value
About This Home
This home is located at 1277 Westover Trace NW, Acworth, GA 30102 and is currently estimated at $397,774, approximately $157 per square foot. 1277 Westover Trace NW is a home located in Cobb County with nearby schools including Pitner Elementary School, Palmer Middle School, and Cornerstone Preparatory Academy.
Ownership History
Date
Name
Owned For
Owner Type
Purchase Details
Closed on
Jul 21, 2011
Sold by
Childs Steve H
Bought by
Ybarra Rosemary
Current Estimated Value
Home Financials for this Owner
Home Financials are based on the most recent Mortgage that was taken out on this home.
Original Mortgage
$146,386
Outstanding Balance
$99,097
Interest Rate
4.25%
Mortgage Type
Trade
Estimated Equity
$298,677
Purchase Details
Closed on
Apr 22, 2011
Sold by
Rosser Steven C
Bought by
Childs Steve H
Purchase Details
Closed on
Sep 13, 2002
Sold by
Mauser George R and Mauser June H
Bought by
Rosser Steven C and Rosser Brenda L
Home Financials for this Owner
Home Financials are based on the most recent Mortgage that was taken out on this home.
Original Mortgage
$153,900
Interest Rate
6.3%
Mortgage Type
New Conventional
Purchase Details
Closed on
May 30, 2001
Sold by
Fulghum Lawrence W and Fulghum Mary E
Bought by
Krumer Mark J
Home Financials for this Owner
Home Financials are based on the most recent Mortgage that was taken out on this home.
Original Mortgage
$164,000
Interest Rate
7.06%
Mortgage Type
New Conventional
Create a Home Valuation Report for This Property
The Home Valuation Report is an in-depth analysis detailing your home's value as well as a comparison with similar homes in the area
Home Values in the Area
Average Home Value in this Area
Purchase History
| Date | Buyer | Sale Price | Title Company |
|---|---|---|---|
| Ybarra Rosemary | $146,400 | -- | |
| Childs Steve H | $135,000 | -- | |
| Rosser Steven C | $162,000 | -- | |
| Krumer Mark J | $205,000 | -- |
Source: Public Records
Mortgage History
| Date | Status | Borrower | Loan Amount |
|---|---|---|---|
| Open | Ybarra Rosemary | $146,386 | |
| Previous Owner | Rosser Steven C | $153,900 | |
| Previous Owner | Krumer Mark J | $164,000 |
Source: Public Records
Tax History Compared to Growth
Tax History
| Year | Tax Paid | Tax Assessment Tax Assessment Total Assessment is a certain percentage of the fair market value that is determined by local assessors to be the total taxable value of land and additions on the property. | Land | Improvement |
|---|---|---|---|---|
| 2025 | $3,093 | $132,044 | $32,000 | $100,044 |
| 2024 | $3,095 | $132,044 | $32,000 | $100,044 |
| 2023 | $2,579 | $133,284 | $30,000 | $103,284 |
| 2022 | $2,581 | $107,428 | $18,000 | $89,428 |
| 2021 | $2,193 | $89,712 | $18,000 | $71,712 |
| 2020 | $2,193 | $89,712 | $18,000 | $71,712 |
| 2019 | $2,037 | $82,596 | $18,000 | $64,596 |
| 2018 | $1,783 | $70,972 | $18,000 | $52,972 |
| 2017 | $1,706 | $70,972 | $18,000 | $52,972 |
| 2016 | $1,708 | $70,972 | $18,000 | $52,972 |
| 2015 | $1,464 | $58,528 | $17,728 | $40,800 |
| 2014 | $1,476 | $58,528 | $0 | $0 |
Source: Public Records
Map
Nearby Homes
- 1276 Westover Trace NW
- 1281 Parkwood Chase NW
- 1159 Midland Dr NW
- 4646 Adams Ln NW
- 4805 Oxford Walk NW
- 4342 White Surrey Dr NW
- 1172 Rockmart Cir NW
- 1140 Reading Dr NW
- 4700 Cromwell Ct NW
- 1361 Summit Ln NW
- 4809 Burlington Ct NW
- 4843 Caboose Ln NW
- 1393 Halpern Ln NW
- 4414 Declan Dr NW
- 4223 Glenlake Pkwy NW
- 1726 Hickory Grove Way NW
- 4949 Woodland Way NW
- 1033 Justice Ln NW
- 1275 Westover Trace NW
- 1273 Westover Trace NW Unit 1
- 1274 Parkwood Chase NW
- 1270 Parkwood Chase NW Unit 2
- 1268 Parkwood Chase NW Unit 2
- 1274 Westover Trace NW
- 1276 Parkwood Chase NW
- 1278 Westover Trace NW
- 1272 Westover Trace NW
- 1271 Westover Trace NW
- 1264 Parkwood Chase NW Unit 3
- 1280 Westover Trace NW
- 1270 Westover Trace NW Unit 1
- 1262 Parkwood Chase NW
- 16 Candler Loop
- 1269 Westover Trace NW
- 15 Candler Loop
- 1282 Westover Trace NW
- 1273 Parkwood Chase NW
- 1268 Westover Trace NW