12772 Lavender Keep Cir Fairfax, VA 22033
Estimated Value: $257,413 - $609,000
3
Beds
2
Baths
1,140
Sq Ft
$343/Sq Ft
Est. Value
About This Home
This home is located at 12772 Lavender Keep Cir, Fairfax, VA 22033 and is currently estimated at $390,471, approximately $342 per square foot. 12772 Lavender Keep Cir is a home located in Fairfax County with nearby schools including Navy Elementary, Franklin Middle, and Chantilly High School.
Ownership History
Date
Name
Owned For
Owner Type
Purchase Details
Closed on
Nov 18, 2021
Sold by
Fairfax Cnty Redevelopment & Hsng Author
Bought by
Benayad Hicham and Cherkaoui Naoual
Current Estimated Value
Home Financials for this Owner
Home Financials are based on the most recent Mortgage that was taken out on this home.
Original Mortgage
$10,000
Outstanding Balance
$9,177
Interest Rate
3.1%
Mortgage Type
FHA
Estimated Equity
$381,294
Purchase Details
Closed on
Jul 20, 2021
Sold by
Malik Shamimur Rehman and Jabeen Farzana
Bought by
Fairfax Cnty Redevelopment & Hsng Author
Purchase Details
Closed on
Jul 28, 2006
Sold by
Mhi Rugby Road Llc
Bought by
Malik Shamim and Jabeen,Furzana
Home Financials for this Owner
Home Financials are based on the most recent Mortgage that was taken out on this home.
Original Mortgage
$135,419
Interest Rate
6.67%
Mortgage Type
New Conventional
Create a Home Valuation Report for This Property
The Home Valuation Report is an in-depth analysis detailing your home's value as well as a comparison with similar homes in the area
Home Values in the Area
Average Home Value in this Area
Purchase History
| Date | Buyer | Sale Price | Title Company |
|---|---|---|---|
| Benayad Hicham | $182,874 | Stewart Title Guaranty Co | |
| Fairfax Cnty Redevelopment & Hsng Author | $180,171 | Stewart Title Guaranty Co | |
| Malik Shamim | $135,419 | -- |
Source: Public Records
Mortgage History
| Date | Status | Borrower | Loan Amount |
|---|---|---|---|
| Open | Benayad Hicham | $10,000 | |
| Open | Benayad Hicham | $172,800 | |
| Previous Owner | Malik Shamim | $135,419 |
Source: Public Records
Tax History Compared to Growth
Tax History
| Year | Tax Paid | Tax Assessment Tax Assessment Total Assessment is a certain percentage of the fair market value that is determined by local assessors to be the total taxable value of land and additions on the property. | Land | Improvement |
|---|---|---|---|---|
| 2025 | $2,332 | $205,510 | $20,550 | $184,960 |
| 2024 | $2,332 | $201,300 | $20,130 | $181,170 |
| 2023 | $2,208 | $195,630 | $19,560 | $176,070 |
| 2022 | $2,103 | $183,930 | $18,390 | $165,540 |
| 2021 | $2,018 | $171,990 | $17,200 | $154,790 |
| 2020 | $2,009 | $169,740 | $16,970 | $152,770 |
| 2019 | $2,001 | $169,050 | $16,910 | $152,140 |
| 2018 | $1,908 | $165,940 | $16,590 | $149,350 |
| 2017 | $1,898 | $163,490 | $16,350 | $147,140 |
| 2016 | $1,883 | $162,520 | $16,250 | $146,270 |
| 2015 | $1,811 | $162,260 | $16,230 | $146,030 |
| 2014 | $1,789 | $160,680 | $16,070 | $144,610 |
Source: Public Records
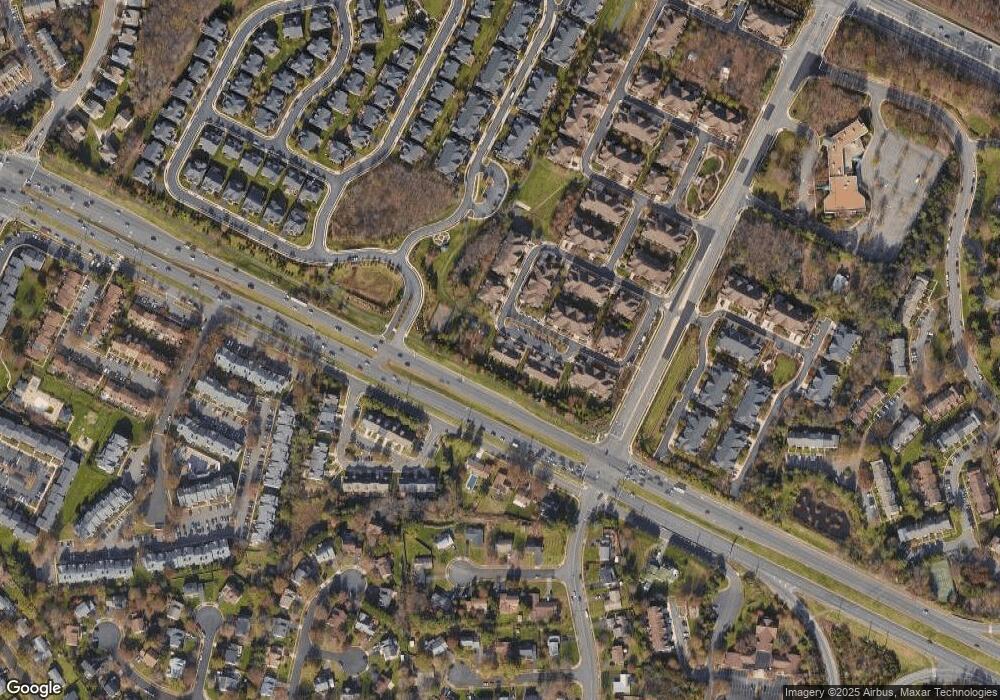
Map
Nearby Homes
- 4001 Middle Ridge Dr
- 12975 Ridgemist Ln
- 4107 Mount Echo Ln
- 4111 Mount Echo Ln
- 3878 Alder Woods Ct
- 4208 Mayport Ln
- 4200 Maylock Ln
- 3861 Alder Woods Ct
- 12820 Point Pleasant Dr
- 3725 Freehill Ln
- 3814 Highland Oaks Dr
- 12608 Victoria Station Ct
- 12465 Blissful Valley Dr
- 12904 Mount Royal Ln
- 4133 Point Hollow Ln
- 3925 Fair Ridge Dr Unit 305
- 3925 Fair Ridge Dr Unit 304
- 3795 Rainier Dr
- 4107 Quiet Crossing Ct
- 4319 Markwood Ln
- 12770 Lavender Keep Cir
- 12774 Lavender Keep Cir
- 12776 Lavender Keep Cir
- 12778 Lavender Keep Cir
- 12780 Lavender Keep Cir
- 12782 Lavender Keep Cir
- 12784 Lavender Keep Cir
- 12760 Lavender Keep Cir
- 12786 Lavender Keep Cir
- 12757 Lavender Keep Cir
- 12788 Lavender Keep Cir
- 12758 Lavender Keep Cir
- 12790 Lavender Keep Cir
- 12781 Lavender Keep Cir
- 12755 Lavender Keep Cir
- 12783 Lavender Keep Cir
- 12756 Lavender Keep Cir
- 12792 Lavender Keep Cir
- 12753 Lavender Keep Cir
- 12785 Lavender Keep Cir