12773 Philadelphia Church Rd Stanfield, NC 28163
Estimated Value: $272,000
11
Beds
8
Baths
--
Sq Ft
209.96
Acres
About This Home
This home is located at 12773 Philadelphia Church Rd, Stanfield, NC 28163 and is currently priced at $272,000. 12773 Philadelphia Church Rd is a home located in Stanly County with nearby schools including Stanfield Elementary School, West Stanly Middle School, and West Stanly High School.
Ownership History
Date
Name
Owned For
Owner Type
Purchase Details
Closed on
Mar 7, 2022
Sold by
Afre 2 Llc
Bought by
Mckinney Deborah Ann
Current Estimated Value
Purchase Details
Closed on
Jan 11, 2021
Sold by
Multiply Chuch Global
Bought by
Jjte Holdings Llc
Purchase Details
Closed on
Mar 31, 2016
Sold by
Afre 3 Llc
Bought by
Cooper James and Cooper Jane
Home Financials for this Owner
Home Financials are based on the most recent Mortgage that was taken out on this home.
Original Mortgage
$128,000
Interest Rate
3.71%
Purchase Details
Closed on
Dec 16, 2015
Sold by
First Assembly Of God
Bought by
Armstrong Dr Thomas W and Armstrong Marla J
Purchase Details
Closed on
Dec 23, 2014
Sold by
Armstrong Thomas W and Armstrong Marla J
Bought by
First Assembly Of God
Purchase Details
Closed on
Jun 24, 2005
Sold by
Lipe Ovella K
Bought by
Armstrong Thomas W and Armstrong Marla J
Create a Home Valuation Report for This Property
The Home Valuation Report is an in-depth analysis detailing your home's value as well as a comparison with similar homes in the area
Home Values in the Area
Average Home Value in this Area
Purchase History
| Date | Buyer | Sale Price | Title Company |
|---|---|---|---|
| Mckinney Deborah Ann | $260,000 | Hankin & Pack Pllc | |
| Jjte Holdings Llc | -- | None Available | |
| Cooper James | -- | -- | |
| Armstrong Dr Thomas W | -- | Attorney | |
| First Assembly Of God | -- | None Available | |
| Armstrong Thomas W | $15,000 | None Available |
Source: Public Records
Mortgage History
| Date | Status | Borrower | Loan Amount |
|---|---|---|---|
| Previous Owner | Cooper James | $128,000 | |
| Previous Owner | Cooper James | -- |
Source: Public Records
Tax History Compared to Growth
Tax History
| Year | Tax Paid | Tax Assessment Tax Assessment Total Assessment is a certain percentage of the fair market value that is determined by local assessors to be the total taxable value of land and additions on the property. | Land | Improvement |
|---|---|---|---|---|
| 2025 | $9,885 | $1,569,010 | $1,063,743 | $505,267 |
| 2024 | $8,440 | $1,156,106 | $664,819 | $491,287 |
| 2023 | $8,440 | $1,156,106 | $664,819 | $491,287 |
| 2022 | $8,324 | $1,156,106 | $664,819 | $491,287 |
| 2021 | $8,260 | $1,163,386 | $672,099 | $491,287 |
| 2020 | $7,921 | $1,039,051 | $629,659 | $409,392 |
| 2019 | $8,001 | $1,039,051 | $629,659 | $409,392 |
| 2018 | $8,001 | $1,039,051 | $629,659 | $409,392 |
| 2017 | $8,001 | $1,039,051 | $629,659 | $409,392 |
| 2016 | $7,503 | $974,423 | $587,219 | $387,204 |
| 2015 | $12,988 | $1,695,421 | $630,169 | $1,065,252 |
| 2014 | $12,659 | $1,695,421 | $630,169 | $1,065,252 |
Source: Public Records
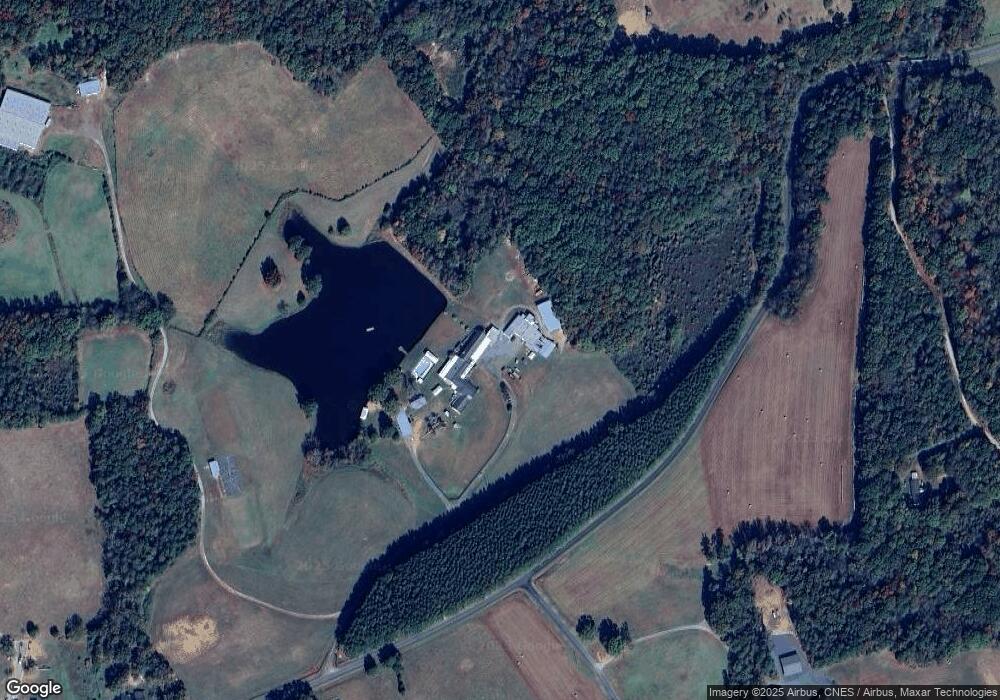
Map
Nearby Homes
- 13080 Philadelphia Church Rd
- 12613 Oak Grove Rd
- 15869 Silver Rd
- 10024 Sedgefield Cir
- 00 Griffin Greene Blvd
- 0000 Silver Rd
- 12093 Coyle Rd
- 12133 Coyle Rd
- 12069 Coyle Rd
- 931 Hollow Hill Ct
- 16433 Silver Rd Unit B
- Tract B Rock Hole Rd
- Tract A Rock Hole Rd
- 8717 Swift Rd
- 16329 Big Lick Rd
- 839 Meadow Dr
- 13801 Saint Thomas Dr
- 13768 Saint Thomas Dr
- 392 N Carolina 200
- 865 Old Farm Rd Unit L24
- 12773 Philadelphia Church Rd
- 12700 Philadelphia Church Rd
- 12655 Philadelphia Church Rd
- 6465 Drye Hill Rd
- 8873 Webb Rd
- 12629 Philadelphia Church Rd
- 8802 Webb Rd
- 8801 Webb Rd
- 12944 Philadelphia Church Rd
- 8808 Webb Rd
- 6424 Drye Hill Rd
- 6405 Drye Hill Rd
- 6414 Drye Hill Rd
- 12616 Philadelphia Church Rd
- 00 Webb Rd
- 6386 Drye Hill Rd
- 12495 Philadelphia Church Rd
- 13023 Philadelphia Church Rd
- 0 Webb Rd
- 8898 Webb Rd