Estimated Value: $282,000 - $305,000
3
Beds
3
Baths
1,814
Sq Ft
$161/Sq Ft
Est. Value
About This Home
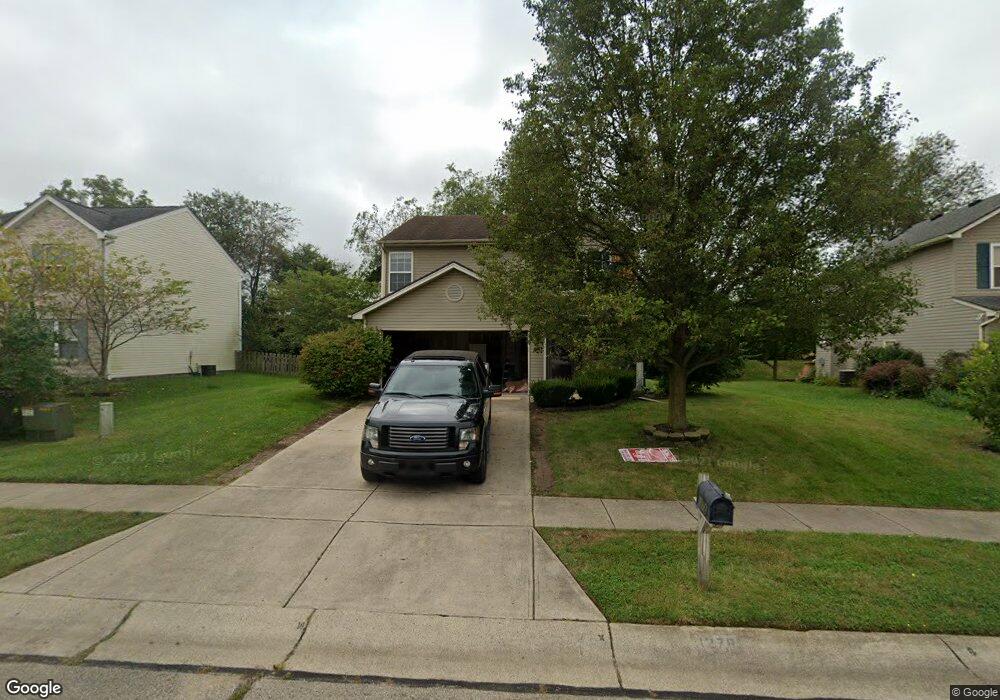
This home is located at 1278 Shannon Ln, Xenia, OH 45385 and is currently estimated at $291,794, approximately $160 per square foot. 1278 Shannon Ln is a home located in Greene County with nearby schools including Xenia High School and Summit Academy Community School for Alternative Learners - Xenia.
Ownership History
Date
Name
Owned For
Owner Type
Purchase Details
Closed on
Oct 7, 2021
Sold by
Allison David and Allison Kimberly
Bought by
Robison Lauren M and Robison Sean M
Current Estimated Value
Home Financials for this Owner
Home Financials are based on the most recent Mortgage that was taken out on this home.
Original Mortgage
$204,232
Outstanding Balance
$186,241
Interest Rate
2.8%
Mortgage Type
FHA
Estimated Equity
$105,553
Purchase Details
Closed on
Feb 16, 2006
Sold by
Camfield Eric L and Camfield Suanne L
Bought by
Allison David and Allison Kimberly
Home Financials for this Owner
Home Financials are based on the most recent Mortgage that was taken out on this home.
Original Mortgage
$103,250
Interest Rate
7.12%
Mortgage Type
Fannie Mae Freddie Mac
Purchase Details
Closed on
Feb 28, 2002
Sold by
Crossmann Communities Of Ohio Inc
Bought by
Camfield Eric L and Camfield Suanne L
Home Financials for this Owner
Home Financials are based on the most recent Mortgage that was taken out on this home.
Original Mortgage
$130,275
Interest Rate
7.03%
Mortgage Type
FHA
Create a Home Valuation Report for This Property
The Home Valuation Report is an in-depth analysis detailing your home's value as well as a comparison with similar homes in the area
Home Values in the Area
Average Home Value in this Area
Purchase History
| Date | Buyer | Sale Price | Title Company |
|---|---|---|---|
| Robison Lauren M | $208,000 | Chicago Title Company Llc | |
| Allison David | $147,500 | None Available | |
| Camfield Eric L | $135,200 | -- |
Source: Public Records
Mortgage History
| Date | Status | Borrower | Loan Amount |
|---|---|---|---|
| Open | Robison Lauren M | $204,232 | |
| Previous Owner | Allison David | $103,250 | |
| Previous Owner | Camfield Eric L | $130,275 |
Source: Public Records
Tax History Compared to Growth
Tax History
| Year | Tax Paid | Tax Assessment Tax Assessment Total Assessment is a certain percentage of the fair market value that is determined by local assessors to be the total taxable value of land and additions on the property. | Land | Improvement |
|---|---|---|---|---|
| 2024 | $3,133 | $73,210 | $16,670 | $56,540 |
| 2023 | $3,133 | $73,210 | $16,670 | $56,540 |
| 2022 | $2,760 | $55,020 | $11,110 | $43,910 |
| 2021 | $2,797 | $55,020 | $11,110 | $43,910 |
| 2020 | $2,680 | $55,020 | $11,110 | $43,910 |
| 2019 | $2,281 | $44,080 | $8,680 | $35,400 |
| 2018 | $2,290 | $44,080 | $8,680 | $35,400 |
| 2017 | $2,255 | $44,080 | $8,680 | $35,400 |
| 2016 | $2,256 | $42,610 | $8,680 | $33,930 |
| 2015 | $2,262 | $42,610 | $8,680 | $33,930 |
| 2014 | $2,166 | $42,610 | $8,680 | $33,930 |
Source: Public Records
Map
Nearby Homes
- 1304 Baybury Ave
- 1298 Baybury Ave
- 1282 Baybury Ave
- 1318 Prem Place
- 1293 Baybury Ave
- 1272 Baybury Ave
- 1292 Baybury Ave
- 1248 Prem Place
- 1161 Shannon Ln
- 1213 Prem Place
- 1474 Hawkshead St
- 2705 Tennessee Dr
- 2821 Raxit Ct
- Chatham Plan at Edenbridge
- Bellamy Plan at Edenbridge
- Holcombe Plan at Edenbridge
- Henley Plan at Edenbridge
- Newcastle Plan at Edenbridge
- 2784 Greystoke Dr
- 2692 Kingman Dr
- 1286 Shannon Ln
- 1270 Shannon Ln
- 1231 Shannon Ln
- 1223 Shannon Ln
- 1260 Shannon Ln
- 1294 Shannon Ln
- 1283 Shannon Ln
- 1217 Shannon Ln
- 1250 Shannon Ln
- 1215 Shannon Ln
- 1302 Shannon Ln
- 1291 Shannon Ln
- 1253 Shannon Ln
- 1242 Shannon Ln
- 1299 Shannon Ln
- 1310 Shannon Ln
- 122 Shannon Ln
- 1241 Shannon Ln
- 3015 W Barnhill Place
- 3026 W Barnhill Place