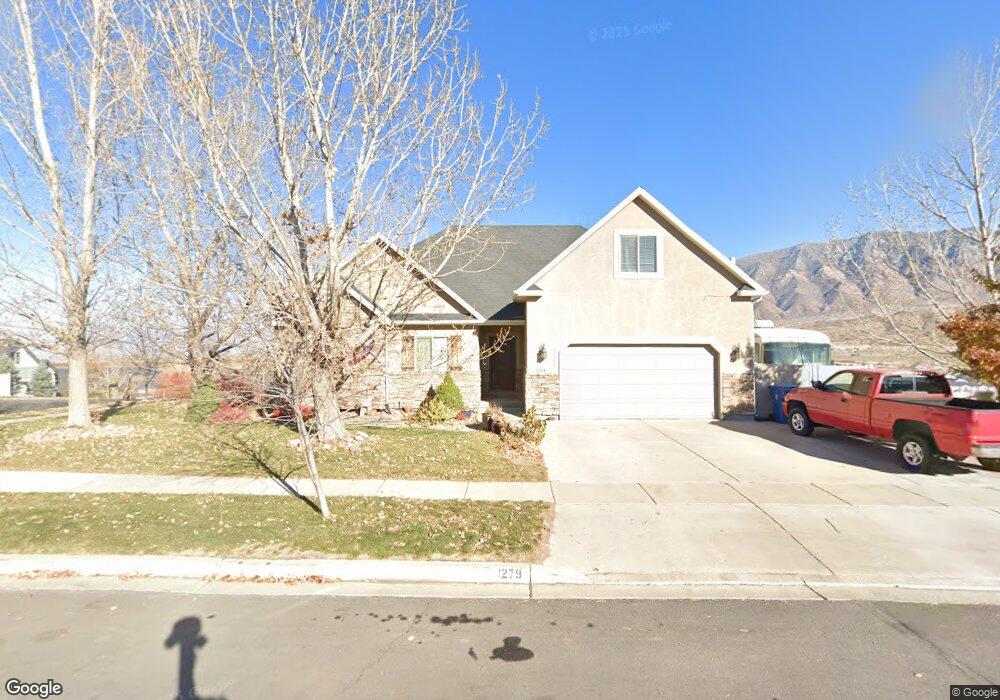
1279 Cedar Pass Dr Santaquin, UT 84655
Estimated Value: $542,000 - $681,000
6
Beds
3
Baths
3,374
Sq Ft
$180/Sq Ft
Est. Value
About This Home
This home is located at 1279 Cedar Pass Dr, Santaquin, UT 84655 and is currently estimated at $606,421, approximately $179 per square foot. 1279 Cedar Pass Dr is a home located in Utah County with nearby schools including Santaquin Elementary School, Payson Junior High School, and Mt. Nebo Middle.
Ownership History
Date
Name
Owned For
Owner Type
Purchase Details
Closed on
Jan 18, 2019
Sold by
Baldwin Carolyn
Bought by
Magoffin Ryan and Magoffin Maritza
Current Estimated Value
Home Financials for this Owner
Home Financials are based on the most recent Mortgage that was taken out on this home.
Original Mortgage
$349,125
Outstanding Balance
$307,572
Interest Rate
4.7%
Mortgage Type
New Conventional
Estimated Equity
$298,849
Purchase Details
Closed on
Sep 30, 2015
Sold by
Sperry Chad C and Sperry Alicia L
Bought by
Baldwin Carolyn
Home Financials for this Owner
Home Financials are based on the most recent Mortgage that was taken out on this home.
Original Mortgage
$216,000
Interest Rate
3.86%
Mortgage Type
New Conventional
Purchase Details
Closed on
Dec 14, 2006
Sold by
Sperry Alicia L
Bought by
Sperry Chad C and Sperry Alicia L
Create a Home Valuation Report for This Property
The Home Valuation Report is an in-depth analysis detailing your home's value as well as a comparison with similar homes in the area
Home Values in the Area
Average Home Value in this Area
Purchase History
| Date | Buyer | Sale Price | Title Company |
|---|---|---|---|
| Magoffin Ryan | -- | North American Title Ut Span | |
| Baldwin Carolyn | -- | Juab Title & Abstract Co | |
| Sperry Chad C | -- | Pro Title & Escrow Inc | |
| Sperry Alicia L | -- | Pro Title & Escrow Inc |
Source: Public Records
Mortgage History
| Date | Status | Borrower | Loan Amount |
|---|---|---|---|
| Open | Magoffin Ryan | $349,125 | |
| Previous Owner | Baldwin Carolyn | $216,000 |
Source: Public Records
Tax History Compared to Growth
Tax History
| Year | Tax Paid | Tax Assessment Tax Assessment Total Assessment is a certain percentage of the fair market value that is determined by local assessors to be the total taxable value of land and additions on the property. | Land | Improvement |
|---|---|---|---|---|
| 2025 | $2,808 | $309,430 | $196,200 | $366,400 |
| 2024 | $2,808 | $279,620 | $0 | $0 |
| 2023 | $2,920 | $291,665 | $0 | $0 |
| 2022 | $3,068 | $316,140 | $0 | $0 |
| 2021 | $2,492 | $398,100 | $90,600 | $307,500 |
| 2020 | $2,328 | $360,400 | $64,700 | $295,700 |
| 2019 | $2,007 | $317,700 | $60,600 | $257,100 |
| 2018 | $1,920 | $289,700 | $56,600 | $233,100 |
| 2017 | $1,960 | $158,070 | $0 | $0 |
| 2016 | $1,877 | $148,280 | $0 | $0 |
| 2015 | $1,879 | $145,585 | $0 | $0 |
| 2014 | $1,715 | $132,605 | $0 | $0 |
Source: Public Records
Map
Nearby Homes
- 1287 Cedar Pass Dr Unit 113
- 1245 Sageberry Dr
- 1263 Crest Dale Ln
- 1186 S Vista Ridge Dr
- 1126 Valley View Dr
- 1217 Crest Dale Ln
- 1341 W View Dr
- 1208 Crest Dale Ln
- 1353 W View Dr
- 1363 W View Dr
- 1276 W View Dr
- 1302 W View Dr
- 1334 W View Dr
- 1344 W View Dr
- 1851 W View Cove
- 1368 W View Dr
- 1022 Vista Ridge Dr Unit 149
- 1473 S Deerbrook Rd Unit 253
- 1380 W View Dr
- 1483 S Deerbrook Rd Unit 254
- 1287 Cedar Pass Dr
- 1287 Cedar Pass Dr Unit 113
- 1266 Sageberry Dr
- 1252 Sageberry Dr Unit 257
- 1252 Sageberry Dr Unit AUBEY
- 1252 Sageberry Dr Unit COLMB
- 1252 Sageberry Dr Unit PNVEW
- 1252 Sageberry Dr Unit MORSIN
- 1252 Sageberry Dr Unit NEBO
- 1252 Sageberry Dr Unit MRTN
- 1252 Sageberry Dr Unit LUCAS
- 1252 Sageberry Dr Unit BXTR
- 1252 Sageberry Dr Unit DRXL
- 1252 Sageberry Dr Unit BALRD
- 1278 Sageberry Dr
- 1282 Cedar Pass Dr
- 1282 Cedar Pass Dr
- 1282 Sycamore Cir
- 1272 Cedar Pass Dr Unit 193
- 1251 Cedar Pass Dr