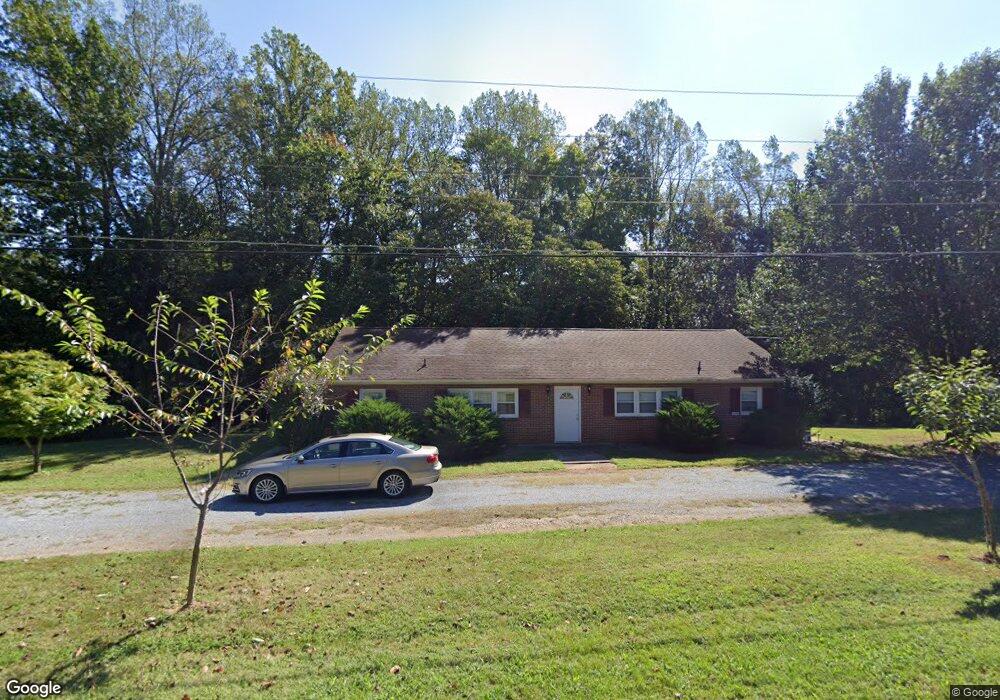
1279 Macon Loop Lynchburg, VA 24503
Estimated Value: $297,456 - $361,000
4
Beds
2
Baths
1,800
Sq Ft
$179/Sq Ft
Est. Value
About This Home
This home is located at 1279 Macon Loop, Lynchburg, VA 24503 and is currently estimated at $322,364, approximately $179 per square foot. 1279 Macon Loop is a home located in Bedford County with nearby schools including Boonsboro Elementary School, Forest Middle School, and Jefferson Forest High School.
Ownership History
Date
Name
Owned For
Owner Type
Purchase Details
Closed on
Nov 9, 2016
Sold by
Martin Christopher E
Bought by
Brosinski Steven Craig and Brosinski Rosalie Sandra
Current Estimated Value
Home Financials for this Owner
Home Financials are based on the most recent Mortgage that was taken out on this home.
Original Mortgage
$65,000
Outstanding Balance
$52,184
Interest Rate
3.42%
Mortgage Type
New Conventional
Estimated Equity
$270,180
Purchase Details
Closed on
Jun 2, 2014
Sold by
Benlohr Llc
Bought by
Martin Christopher E
Home Financials for this Owner
Home Financials are based on the most recent Mortgage that was taken out on this home.
Original Mortgage
$97,500
Interest Rate
4.75%
Mortgage Type
New Conventional
Purchase Details
Closed on
Feb 20, 2010
Sold by
Weaveyl Llc
Bought by
Benlohr Llc
Purchase Details
Closed on
Mar 7, 2007
Sold by
Weaver Benjamin F and Weaver Yvonne L
Bought by
Weaveyl Llc
Create a Home Valuation Report for This Property
The Home Valuation Report is an in-depth analysis detailing your home's value as well as a comparison with similar homes in the area
Purchase History
| Date | Buyer | Sale Price | Title Company |
|---|---|---|---|
| Brosinski Steven Craig | $130,000 | Global Title Services | |
| Martin Christopher E | $130,000 | Old Republic National Title | |
| Benlohr Llc | -- | None Available | |
| Weaveyl Llc | -- | None Available |
Source: Public Records
Mortgage History
| Date | Status | Borrower | Loan Amount |
|---|---|---|---|
| Open | Brosinski Steven Craig | $65,000 | |
| Previous Owner | Martin Christopher E | $97,500 |
Source: Public Records
Tax History
| Year | Tax Paid | Tax Assessment Tax Assessment Total Assessment is a certain percentage of the fair market value that is determined by local assessors to be the total taxable value of land and additions on the property. | Land | Improvement |
|---|---|---|---|---|
| 2025 | $816 | $199,000 | $60,000 | $139,000 |
| 2024 | $816 | $199,000 | $60,000 | $139,000 |
| 2023 | $816 | $99,500 | $0 | $0 |
| 2022 | $651 | $65,100 | $0 | $0 |
| 2021 | $651 | $130,200 | $35,000 | $95,200 |
| 2020 | $651 | $130,200 | $35,000 | $95,200 |
| 2019 | $651 | $130,200 | $35,000 | $95,200 |
| 2018 | $677 | $130,200 | $35,000 | $95,200 |
| 2017 | $677 | $130,200 | $35,000 | $95,200 |
| 2016 | $677 | $130,200 | $35,000 | $95,200 |
| 2015 | $677 | $130,200 | $35,000 | $95,200 |
| 2014 | $563 | $108,300 | $32,000 | $76,300 |
Source: Public Records
Map
Nearby Homes
- 1146 Macon Loop
- 1139 Macon Loop
- 113 Fairwood Ct
- 109 Evergreen Ridge Dr
- 103 Millwoods Rd N
- 106 Howard Dr
- 172 Mill Lane Rd
- 101 Oakmont Ct
- 100 Jameson Ct
- 107 Fox Hollow Rd
- 2125 Walnut Hollow Rd
- 1229 Boone Hill Dr
- 209 Two Creek Dr
- 109 Trinity Ct
- 0 Two Creek Dr
- 103 Waterton Dr
- 1933 Royal Oak Dr
- 101 Mckenna Cir
- 105 Bethel Park Dr
- 100 Stables Ln
- 1203 Boonsboro Place
- 1234 Boonsboro Place
- 1273 Boonsboro Place
- 1261 Macon Loop
- 1230 Boonsboro Place
- 1185 Boonsboro Place
- 1276 Boonsboro Place
- 1258 Macon Loop
- 1190 Boonsboro Place
- 1300 Boonsboro Place
- 1182 Boonsboro Place
- 1157 Boonsboro Place
- 1175 Boonsboro Place
- 1245 Macon Loop
- 1190 Macon Loop
- 1334 Boonsboro Place
- 1180 Macon Loop
- 1141 Boonsboro Place
- 1340 Boonsboro Place
- 1223 Macon Loop
Your Personal Tour Guide
Ask me questions while you tour the home.