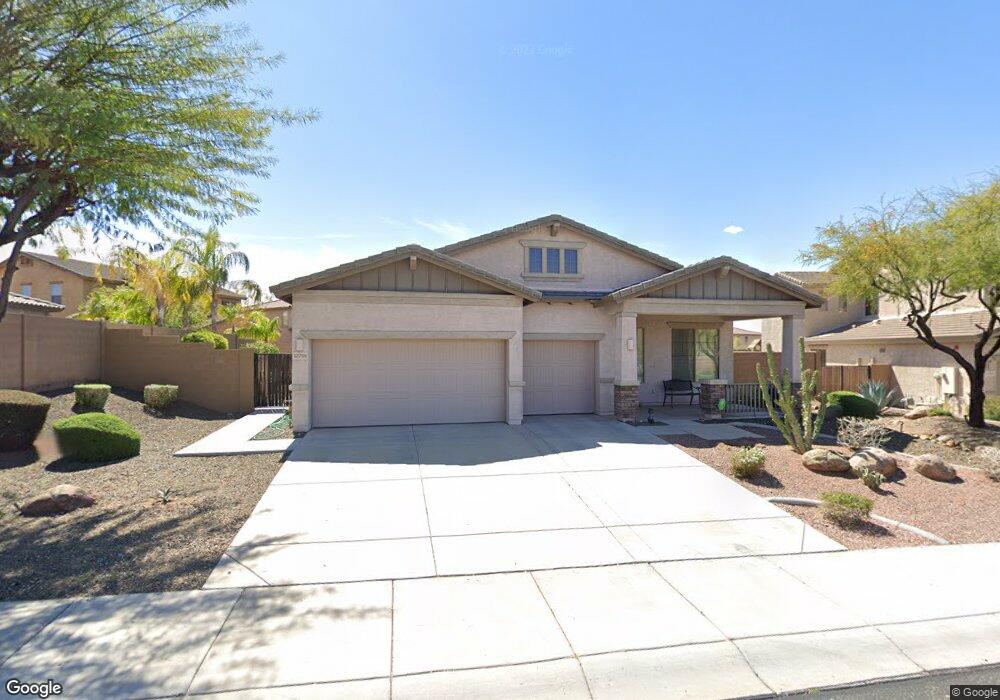
12791 W Dove Wing Way Peoria, AZ 85383
Estimated Value: $534,000 - $566,000
4
Beds
2
Baths
2,162
Sq Ft
$252/Sq Ft
Est. Value
About This Home
This home is located at 12791 W Dove Wing Way, Peoria, AZ 85383 and is currently estimated at $545,263, approximately $252 per square foot. 12791 W Dove Wing Way is a home located in Maricopa County with nearby schools including Vistancia Elementary School and Liberty High School.
Ownership History
Date
Name
Owned For
Owner Type
Purchase Details
Closed on
Jan 19, 2018
Sold by
Hoffman Robert Michael and Hoffman Barbara Rose
Bought by
Hoffman Robert Michael and Hoffman Barbara Rose
Current Estimated Value
Purchase Details
Closed on
Jun 25, 2010
Sold by
919942 Alberta Limited
Bought by
Hoffman Robert M and Hoffman Barbara R
Purchase Details
Closed on
Dec 5, 2007
Sold by
Haase Darrell and Haase Lorna
Bought by
919942 Alberta Ltd
Purchase Details
Closed on
Nov 7, 2007
Sold by
Henderson Autumn and Henderson Robert C
Bought by
Haase Darrell and Haase Lorna
Purchase Details
Closed on
Oct 31, 2005
Sold by
Engle/Sunbelt Llc
Bought by
Sieb Autumn and Henderson Robert C
Home Financials for this Owner
Home Financials are based on the most recent Mortgage that was taken out on this home.
Original Mortgage
$220,000
Interest Rate
5.74%
Mortgage Type
New Conventional
Purchase Details
Closed on
May 11, 2005
Sold by
Acacia Credit Fund 9-A Llc
Bought by
Tousa Homes Inc
Create a Home Valuation Report for This Property
The Home Valuation Report is an in-depth analysis detailing your home's value as well as a comparison with similar homes in the area
Home Values in the Area
Average Home Value in this Area
Purchase History
| Date | Buyer | Sale Price | Title Company |
|---|---|---|---|
| Hoffman Robert Michael | -- | None Available | |
| Hoffman Robert M | $295,000 | Security Title Agency | |
| 919942 Alberta Ltd | -- | Grand Canyon Title Agency | |
| Haase Darrell | $380,000 | Grand Cyn Title Agency Inc | |
| Sieb Autumn | $432,146 | Universal Land Title Agency | |
| Tousa Homes Inc | $1,384,699 | -- |
Source: Public Records
Mortgage History
| Date | Status | Borrower | Loan Amount |
|---|---|---|---|
| Previous Owner | Sieb Autumn | $220,000 |
Source: Public Records
Tax History Compared to Growth
Tax History
| Year | Tax Paid | Tax Assessment Tax Assessment Total Assessment is a certain percentage of the fair market value that is determined by local assessors to be the total taxable value of land and additions on the property. | Land | Improvement |
|---|---|---|---|---|
| 2025 | $2,436 | $26,056 | -- | -- |
| 2024 | $3,148 | $27,325 | -- | -- |
| 2023 | $3,148 | $41,820 | $8,360 | $33,460 |
| 2022 | $3,124 | $33,100 | $6,620 | $26,480 |
| 2021 | $3,220 | $31,220 | $6,240 | $24,980 |
| 2020 | $3,214 | $28,570 | $5,710 | $22,860 |
| 2019 | $3,110 | $26,520 | $5,300 | $21,220 |
| 2018 | $2,999 | $24,930 | $4,980 | $19,950 |
| 2017 | $2,973 | $23,920 | $4,780 | $19,140 |
| 2016 | $2,519 | $24,850 | $4,970 | $19,880 |
| 2015 | $2,729 | $20,560 | $4,110 | $16,450 |
Source: Public Records
Map
Nearby Homes
- 12838 W Desert Mirage Dr
- 29998 N 128th Ave
- 12845 W Milton Dr
- 30056 N 129th Ave
- 29989 N Whipsaw Rd
- 29706 N 127th Ln
- 12515 W Red Hawk Dr
- 12956 W Eagle Ridge Ln
- 12958 W Fossil Dr
- 30277 N 125th Ln
- 29624 N 128th Ln
- 12964 W Fossil Dr
- 30680 N 126th Dr
- 26379 N 77th Glen
- 12512 W Desert Mirage Dr
- 12519 W Palo Brea Ln
- 12775 W Lowden Rd
- 12679 W Lowden Rd
- 12481 W Milton Dr
- 30383 N 131st Dr
- 12803 W Dove Wing Way
- 12746 W Eagle Ridge Ln
- 12734 W Eagle Ridge Ln
- 12758 W Eagle Ridge Ln
- 12815 W Dove Wing Way
- 12770 W Eagle Ridge Ln
- 12798 W Dove Wing Way
- 12786 W Dove Wing Way
- 12782 W Eagle Ridge Ln
- 12774 W Dove Wing Way
- 12762 W Dove Wing Way
- 30037 N 128th Ave
- 30025 N 128th Ave
- 12741 W Eagle Ridge Ln
- 12731 W Eagle Ridge Ln
- 12822 W Dove Wing Way
- 12750 W Dove Wing Way
- 12745 W Eagle Ridge Ln
- 12753 W Eagle Ridge Ln
- 12765 W Eagle Ridge Ln