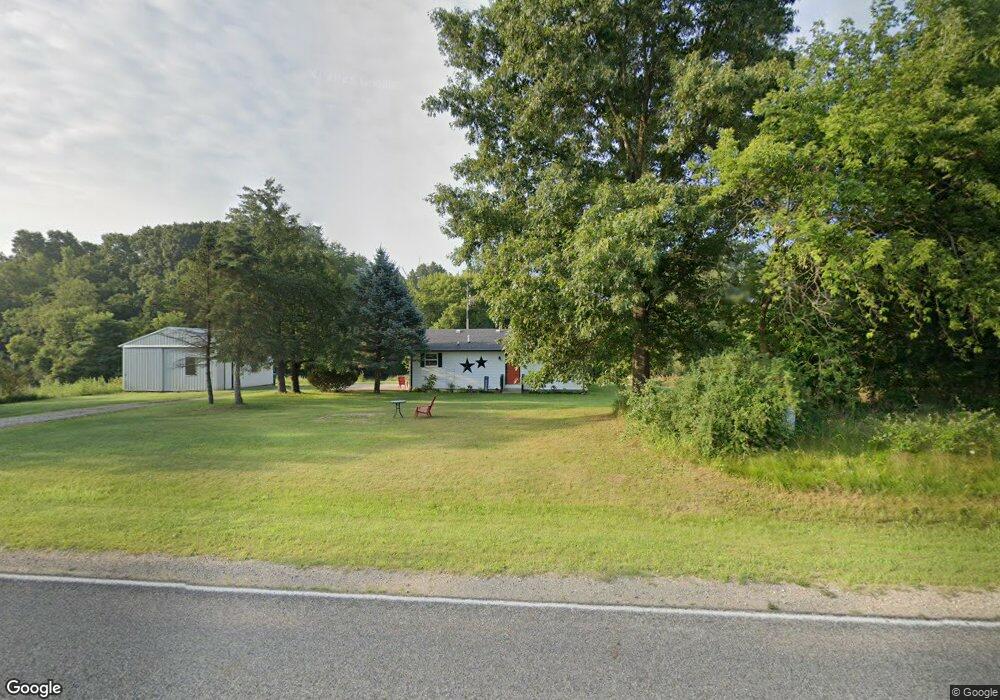
12793 Hoffman Rd Three Rivers, MI 49093
Estimated Value: $229,000 - $250,000
2
Beds
1
Bath
1,040
Sq Ft
$229/Sq Ft
Est. Value
About This Home
This home is located at 12793 Hoffman Rd, Three Rivers, MI 49093 and is currently estimated at $237,825, approximately $228 per square foot. 12793 Hoffman Rd is a home located in St. Joseph County.
Ownership History
Date
Name
Owned For
Owner Type
Purchase Details
Closed on
Aug 8, 2025
Sold by
Miller Emma
Bought by
Fisk Allen Robert
Current Estimated Value
Home Financials for this Owner
Home Financials are based on the most recent Mortgage that was taken out on this home.
Original Mortgage
$230,743
Outstanding Balance
$230,545
Interest Rate
6.77%
Mortgage Type
FHA
Estimated Equity
$7,280
Purchase Details
Closed on
Oct 21, 2022
Sold by
Peck Kristy and Peck Chad
Bought by
Miller Emma
Purchase Details
Closed on
Apr 8, 2022
Sold by
Suzanne Peck-Childs
Bought by
Peck Kristy and Peck Chad
Purchase Details
Closed on
Feb 24, 2021
Sold by
Childs Suzanne C and Peck Harold Elgin
Bought by
Childs Suzanne Peck
Purchase Details
Closed on
Jun 5, 2006
Sold by
Peck Harold Elgin
Bought by
Peck Harold Elgin and Peck Chad Edward
Purchase Details
Closed on
Jul 24, 2003
Sold by
Peck Harold Elgin
Bought by
Peck Harold and Peck Kristy
Purchase Details
Closed on
Jan 6, 1999
Sold by
Peck Harold E and Peck Ada L
Bought by
Peck Harold E
Purchase Details
Closed on
Apr 18, 1996
Create a Home Valuation Report for This Property
The Home Valuation Report is an in-depth analysis detailing your home's value as well as a comparison with similar homes in the area
Purchase History
| Date | Buyer | Sale Price | Title Company |
|---|---|---|---|
| Fisk Allen Robert | $235,000 | Patrick Abstract & Title | |
| Miller Emma | $110,000 | None Listed On Document | |
| Peck Kristy | -- | Hines Law Pc | |
| Childs Suzanne Peck | -- | None Available | |
| Peck Harold Elgin | -- | None Available | |
| Peck Harold | -- | -- | |
| Peck Harold E | -- | -- | |
| -- | -- | -- |
Source: Public Records
Mortgage History
| Date | Status | Borrower | Loan Amount |
|---|---|---|---|
| Open | Fisk Allen Robert | $230,743 |
Source: Public Records
Tax History
| Year | Tax Paid | Tax Assessment Tax Assessment Total Assessment is a certain percentage of the fair market value that is determined by local assessors to be the total taxable value of land and additions on the property. | Land | Improvement |
|---|---|---|---|---|
| 2025 | $787 | $87,900 | $27,200 | $60,700 |
| 2024 | $765 | $80,700 | $22,000 | $58,700 |
| 2023 | $729 | $69,300 | $16,800 | $52,500 |
| 2022 | $0 | $65,800 | $15,200 | $50,600 |
| 2021 | $1,506 | $57,800 | $14,000 | $43,800 |
| 2020 | $0 | $52,200 | $13,200 | $39,000 |
| 2019 | $467 | $53,900 | $12,500 | $41,400 |
| 2018 | $1,048 | $51,800 | $12,500 | $39,300 |
| 2017 | $1,037 | $50,600 | $50,600 | $0 |
| 2016 | -- | $49,200 | $49,200 | $0 |
| 2015 | -- | $45,900 | $0 | $0 |
| 2014 | -- | $46,500 | $46,500 | $0 |
| 2012 | -- | $47,600 | $47,600 | $0 |
Source: Public Records
Map
Nearby Homes
- Lot 6 Highfield Rd
- 17 Highfield Rd
- 18 Highfield Rd
- 9 Highfield Rd
- 8 Highfield Rd
- Lot 7 Highfield Rd
- 10 Kuhn Rd
- 57586 Gearhart Landing Rd
- v/l Bidelman Rd
- 12417 Sunset Dr
- 58420 Sunset Shores Ct
- 57689 Lone Tree Rd
- 10881 Hoffman Rd
- 58463 Loop Rd
- 15068 Mohney Lake Rd
- 13060 Broadway Rd
- 0 Oak Dr
- 15033 Millard Rd
- 10281 Walnut Dr
- 17803 Bluff Dr
- 57081 Highfield Rd
- 12695 Hoffman Rd
- 12887 Hoffman Rd
- 57066 Gearharts Landing Rd
- 57066 Gearharts Landing Rd
- 57066 Gearharts Landing Rd
- 57066 Gearhart Landing Rd
- 57022 Gearharts Landing Rd
- 12629 Hoffman Rd
- 57184 Gearharts Landing Rd
- 57022 Gearhart Landing Rd
- 12760 Kuhn Rd
- Lot 141 Hoffman Rd
- Lot 142 Hoffman Rd
- 01 Hoffman Rd
- 141-142 Hoffman Rd
- 13000 Hoffman Rd
- 12587 Hoffman Rd
- VL Highfield Rd
- Parcel D Highfield Rd
Your Personal Tour Guide
Ask me questions while you tour the home.