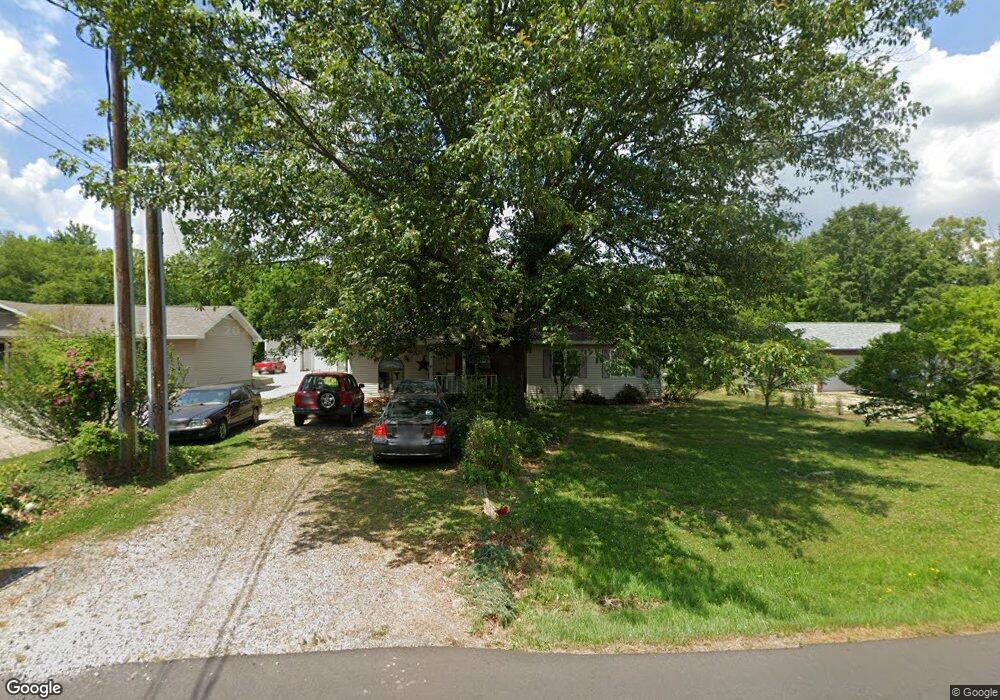
12798 W 300 N Linton, IN 47441
Estimated Value: $140,507 - $224,000
--
Bed
1
Bath
1,305
Sq Ft
$141/Sq Ft
Est. Value
About This Home
This home is located at 12798 W 300 N, Linton, IN 47441 and is currently estimated at $183,877, approximately $140 per square foot. 12798 W 300 N is a home with nearby schools including Linton-Stockton Elementary School, Linton-Stockton Junior High School, and Linton-Stockton High School.
Ownership History
Date
Name
Owned For
Owner Type
Purchase Details
Closed on
Aug 23, 2007
Sold by
Rickelman Kelli Lynn and Bruhn Kelli Lynn
Bought by
Rickelman Kellin Lynn and Rickelman Donald
Current Estimated Value
Home Financials for this Owner
Home Financials are based on the most recent Mortgage that was taken out on this home.
Original Mortgage
$80,000
Interest Rate
6.72%
Mortgage Type
New Conventional
Create a Home Valuation Report for This Property
The Home Valuation Report is an in-depth analysis detailing your home's value as well as a comparison with similar homes in the area
Home Values in the Area
Average Home Value in this Area
Purchase History
| Date | Buyer | Sale Price | Title Company |
|---|---|---|---|
| Rickelman Kellin Lynn | -- | Industry Partners Title Llc |
Source: Public Records
Mortgage History
| Date | Status | Borrower | Loan Amount |
|---|---|---|---|
| Closed | Rickelman Kellin Lynn | $80,000 |
Source: Public Records
Tax History Compared to Growth
Tax History
| Year | Tax Paid | Tax Assessment Tax Assessment Total Assessment is a certain percentage of the fair market value that is determined by local assessors to be the total taxable value of land and additions on the property. | Land | Improvement |
|---|---|---|---|---|
| 2024 | $1,588 | $92,300 | $11,200 | $81,100 |
| 2023 | $1,352 | $91,400 | $11,200 | $80,200 |
| 2022 | $539 | $81,600 | $11,200 | $70,400 |
| 2021 | $454 | $72,400 | $11,200 | $61,200 |
| 2020 | $467 | $76,300 | $11,200 | $65,100 |
| 2019 | $458 | $72,300 | $11,200 | $61,100 |
| 2018 | $405 | $66,500 | $11,200 | $55,300 |
| 2017 | $367 | $63,000 | $11,200 | $51,800 |
| 2016 | $351 | $65,700 | $11,200 | $54,500 |
| 2014 | $37 | $63,000 | $11,200 | $51,800 |
| 2013 | -- | $62,500 | $11,200 | $51,300 |
Source: Public Records
Map
Nearby Homes