128 14th St Cresskill, NJ 07626
Estimated Value: $905,000 - $984,000
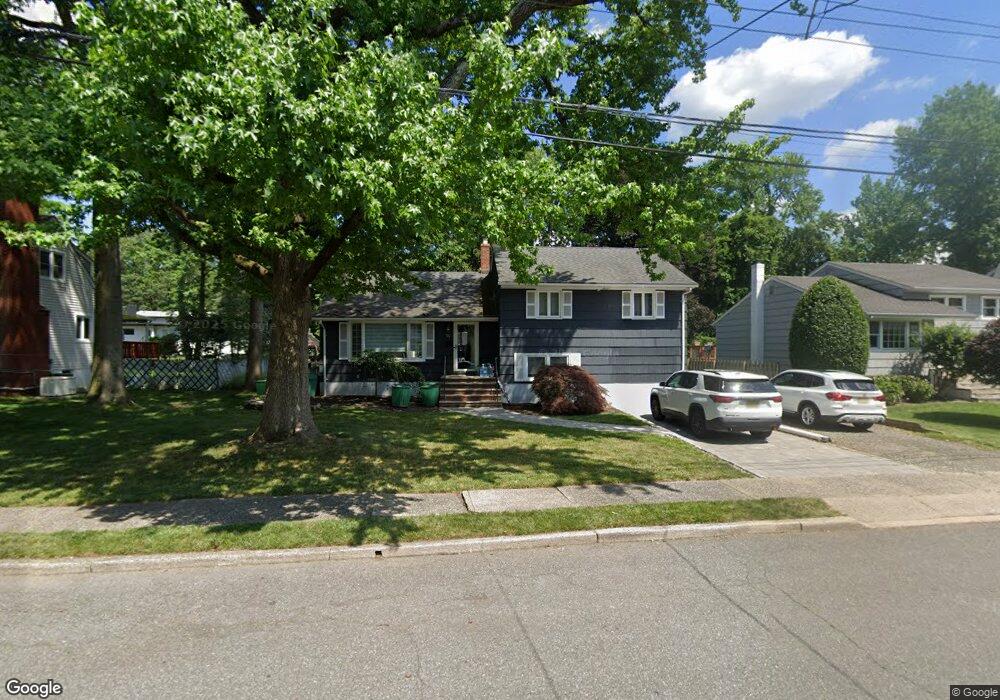
About This Home
This home is located at 128 14th St, Cresskill, NJ 07626 and is currently estimated at $941,112, approximately $445 per square foot. 128 14th St is a home located in Bergen County with nearby schools including Cresskill High School.
Ownership History
We collect this data history from publicly available records. To have your information removed, we recommend requesting removal directly through your county’s website.
Purchase Details
Home Financials for this Owner
Home Financials are based on the most recent Mortgage that was taken out on this home.Purchase Details
Home Values in the Area
Average Home Value in this Area
Purchase History
We collect this data history from publicly available records. To have your information removed, we recommend requesting removal directly through your county’s website.
| Date | Buyer | Sale Price | Title Company |
|---|---|---|---|
| $480,000 | None Available | ||
| -- | -- |
Mortgage History
We collect this data history from publicly available records. To have your information removed, we recommend requesting removal directly through your county’s website.
| Date | Status | Borrower | Loan Amount |
|---|---|---|---|
| Open | $384,000 |
Tax History
We collect this data history from publicly available records. To have your information removed, we recommend requesting removal directly through your county’s website.
| Year | Tax Paid | Tax Assessment Tax Assessment Total Assessment is a certain percentage of the fair market value that is determined by local assessors to be the total taxable value of land and additions on the property. | Land | Improvement |
|---|---|---|---|---|
| 2025 | $13,883 | $654,000 | $408,400 | $245,600 |
| 2024 | $13,487 | $603,600 | $365,600 | $238,000 |
| 2023 | $13,188 | $581,100 | $348,100 | $233,000 |
| 2022 | $13,188 | $547,900 | $322,700 | $225,200 |
| 2021 | $13,067 | $535,100 | $315,200 | $219,900 |
| 2020 | $12,498 | $513,900 | $306,700 | $207,200 |
| 2019 | $12,225 | $507,900 | $303,200 | $204,700 |
| 2018 | $8,494 | $503,800 | $300,200 | $203,600 |
| 2017 | $11,718 | $430,500 | $228,000 | $202,500 |
| 2016 | $11,370 | $430,500 | $228,000 | $202,500 |
| 2015 | $11,017 | $430,500 | $228,000 | $202,500 |
| 2014 | $10,685 | $430,500 | $228,000 | $202,500 |
Map
- 104 14th St
- 30 Elm St
- 292 Magnolia Ave
- 23 Cherry Ct
- 3 Wolcott Rd
- 284 Madison Ave
- 595 Knickerbocker Rd
- 21 Cedar St
- 267 Hickory Ave
- 177 Magnolia Ave
- 249 Madison Ave
- 20 Wilcox St
- 20 Blish Place
- 55 Cedar St
- 59 Colonial Pkwy
- 60 Merritt Ave
- 364 Knickerbocker Rd
- 12 Chestnut St
- 174 Phelps Ave
- 111 Magnolia Ave
Ask me questions while you tour the home.