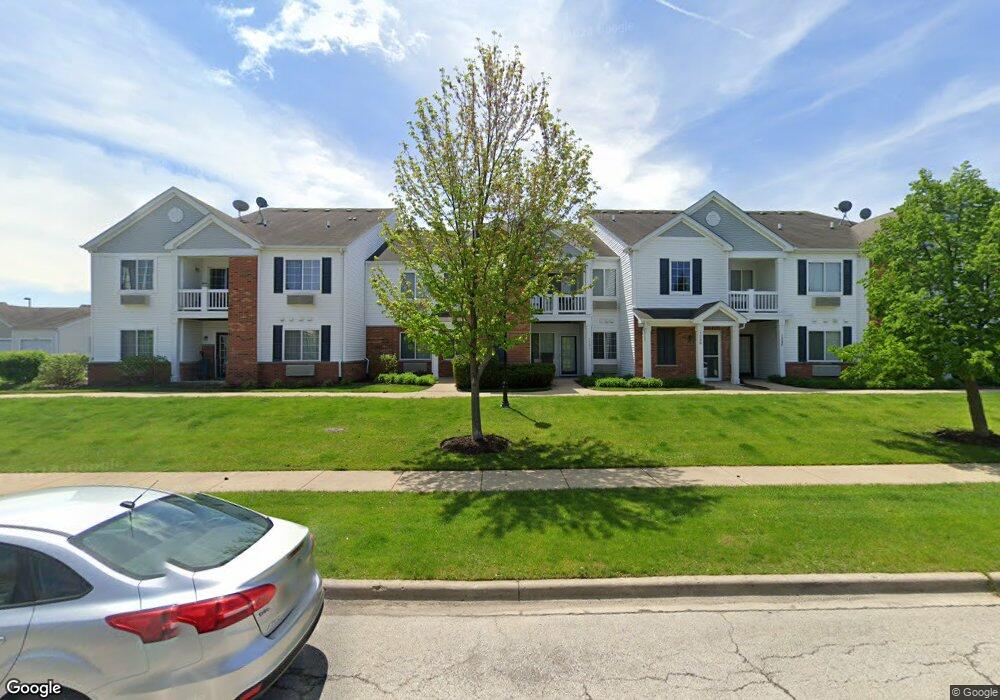
128 Bertram Dr Unit G Yorkville, IL 60560
Bristol-Kendall County NeighborhoodEstimated Value: $164,000 - $172,000
1
Bed
1
Bath
850
Sq Ft
$199/Sq Ft
Est. Value
About This Home
This home is located at 128 Bertram Dr Unit G, Yorkville, IL 60560 and is currently estimated at $168,898, approximately $198 per square foot. 128 Bertram Dr Unit G is a home located in Kendall County with nearby schools including Bristol Bay Elementary School, Yorkville Middle School, and Yorkville High School.
Ownership History
Date
Name
Owned For
Owner Type
Purchase Details
Closed on
Jan 14, 2022
Sold by
Richard Krey
Bought by
West Barry G
Current Estimated Value
Home Financials for this Owner
Home Financials are based on the most recent Mortgage that was taken out on this home.
Original Mortgage
$111,550
Interest Rate
3.69%
Mortgage Type
New Conventional
Purchase Details
Closed on
Nov 9, 2011
Sold by
Secretary Of Housing & Urban Development
Bought by
Krey Richard
Purchase Details
Closed on
Nov 25, 2009
Sold by
Ramic Fikret
Bought by
The Secretary Of Housing & Urban Develop
Purchase Details
Closed on
Mar 1, 2006
Sold by
Centex Homes
Bought by
Ramic Fikret
Home Financials for this Owner
Home Financials are based on the most recent Mortgage that was taken out on this home.
Original Mortgage
$121,377
Interest Rate
6.37%
Mortgage Type
FHA
Create a Home Valuation Report for This Property
The Home Valuation Report is an in-depth analysis detailing your home's value as well as a comparison with similar homes in the area
Home Values in the Area
Average Home Value in this Area
Purchase History
| Date | Buyer | Sale Price | Title Company |
|---|---|---|---|
| West Barry G | $115,000 | None Listed On Document | |
| Krey Richard | -- | Stewart Title Company | |
| The Secretary Of Housing & Urban Develop | -- | None Available | |
| Ramic Fikret | $123,500 | Chicago Title Insurance Co |
Source: Public Records
Mortgage History
| Date | Status | Borrower | Loan Amount |
|---|---|---|---|
| Previous Owner | West Barry G | $111,550 | |
| Previous Owner | Ramic Fikret | $121,377 |
Source: Public Records
Tax History Compared to Growth
Tax History
| Year | Tax Paid | Tax Assessment Tax Assessment Total Assessment is a certain percentage of the fair market value that is determined by local assessors to be the total taxable value of land and additions on the property. | Land | Improvement |
|---|---|---|---|---|
| 2024 | $4,497 | $43,740 | $3,397 | $40,343 |
| 2023 | $4,758 | $39,134 | $3,039 | $36,095 |
| 2022 | $4,758 | $35,528 | $2,759 | $32,769 |
| 2021 | $4,531 | $32,549 | $2,759 | $29,790 |
| 2020 | $4,248 | $29,849 | $2,759 | $27,090 |
| 2019 | $4,032 | $27,135 | $2,508 | $24,627 |
| 2018 | $3,706 | $23,189 | $2,508 | $20,681 |
| 2017 | $3,463 | $20,184 | $2,508 | $17,676 |
| 2016 | $1,619 | $17,488 | $2,508 | $14,980 |
| 2015 | -- | $17,406 | $2,508 | $14,898 |
| 2014 | -- | $17,406 | $2,508 | $14,898 |
| 2013 | -- | $17,955 | $2,508 | $15,447 |
Source: Public Records
Map
Nearby Homes
- 206 Burnett St
- 124 Bertram Dr Unit M
- 4574 Half Moon Dr Unit C
- 4555 Camden Ln Unit C
- 4566 Camden Ln Unit D
- 4579 Half Moon Dr Unit A
- 4568 Garritano St Unit A
- 181 Willoughby Ct Unit B
- 171 Willoughby Ct Unit E
- 4522 Gardiner Ave
- 4686 Plymouth Ave
- 412 Biscayne Ln
- 4478 Sarasota Ave
- 3401 Helene Rieder Dr
- 9439 Corneils Rd
- 1-32 Corneils Rd
- 2335 Thunder Gulch Rd Unit 4
- 3177 Whirlaway Ln
- 14 Hunter Ln
- 1850 Candlelight Cir Unit 173
- 128 Bertram Dr
- 128 Bertram Dr Unit K
- 128 Bertram Dr Unit 1631B
- 128 Bertram Dr Unit C
- 128 Bertram Dr Unit L
- 128 Bertram Dr Unit A
- 128 Bertram Dr Unit O
- 128 Bertram Dr Unit P
- 128 Bertram Dr Unit J
- 128 Bertram Dr Unit I
- 128 Bertram Dr
- 128 Bertram Dr Unit F
- 128 Bertram Dr Unit H
- 128 Bertram Dr Unit D
- 128 Bertram Dr Unit B
- 126 Bertram Dr
- 126 Bertram Dr Unit P
- 126 Bertram Dr Unit H
- 126 Bertram Dr Unit I
- 126 Bertram Dr Unit M