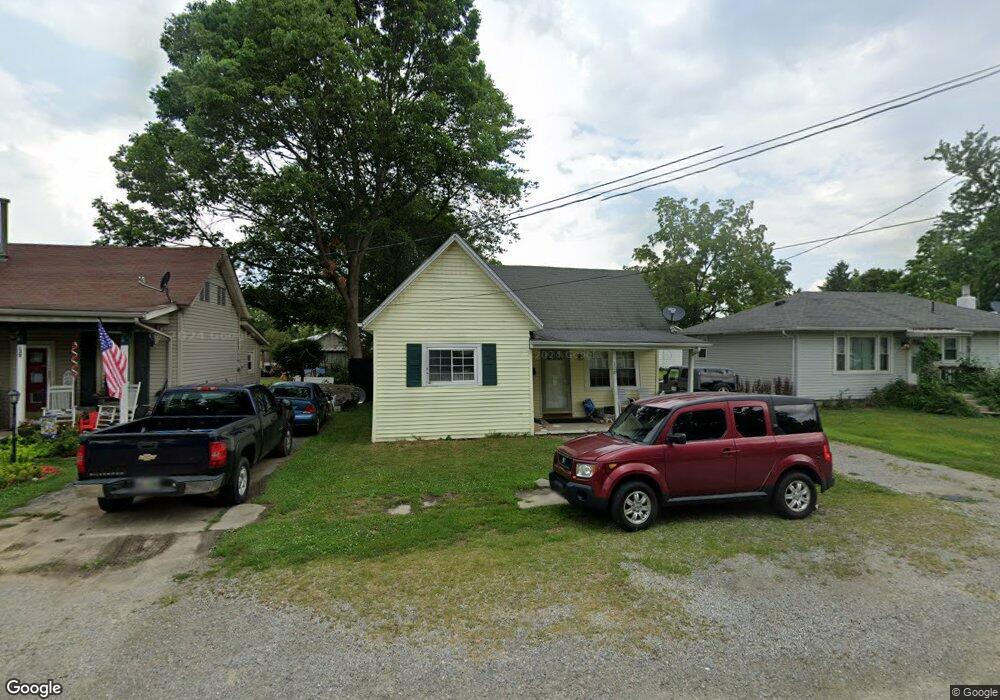
128 Central Ave Blanchester, OH 45107
Estimated Value: $108,000 - $155,000
2
Beds
1
Bath
822
Sq Ft
$165/Sq Ft
Est. Value
About This Home
This home is located at 128 Central Ave, Blanchester, OH 45107 and is currently estimated at $135,229, approximately $164 per square foot. 128 Central Ave is a home located in Clinton County with nearby schools including Putman Elementary School, Blanchester Middle School, and Blanchester High School.
Ownership History
Date
Name
Owned For
Owner Type
Purchase Details
Closed on
Nov 16, 2012
Sold by
King Ronald P and King Lindsey R
Bought by
Johnson Ronald J and Johnson Deborah A
Current Estimated Value
Home Financials for this Owner
Home Financials are based on the most recent Mortgage that was taken out on this home.
Original Mortgage
$10,418
Interest Rate
3.37%
Purchase Details
Closed on
Sep 28, 2004
Sold by
Hacker Dennis B and Hacker Myrtle E
Bought by
King Ronald P and King Lindsey R
Purchase Details
Closed on
Sep 24, 2004
Sold by
Hacker Dennis B and Hacker Myrtle E
Bought by
King Ronald P and King Lindsey R
Purchase Details
Closed on
Apr 13, 2004
Sold by
Miller Beulah L
Bought by
Hacker Dennis B and Hacker Myrtle E
Purchase Details
Closed on
Apr 6, 2004
Sold by
Miller Beulah L and Strider Clayton M
Bought by
Hacker Dennis B and Hacker Myrtle E
Purchase Details
Closed on
Jan 1, 1990
Bought by
Miller Gerald E
Create a Home Valuation Report for This Property
The Home Valuation Report is an in-depth analysis detailing your home's value as well as a comparison with similar homes in the area
Home Values in the Area
Average Home Value in this Area
Purchase History
| Date | Buyer | Sale Price | Title Company |
|---|---|---|---|
| Johnson Ronald J | -- | -- | |
| King Ronald P | $25,000 | -- | |
| King Ronald P | $25,000 | -- | |
| Hacker Dennis B | $18,500 | -- | |
| Hacker Dennis B | $18,500 | -- | |
| Miller Gerald E | -- | -- |
Source: Public Records
Mortgage History
| Date | Status | Borrower | Loan Amount |
|---|---|---|---|
| Previous Owner | Johnson Ronald J | $10,418 |
Source: Public Records
Tax History
| Year | Tax Paid | Tax Assessment Tax Assessment Total Assessment is a certain percentage of the fair market value that is determined by local assessors to be the total taxable value of land and additions on the property. | Land | Improvement |
|---|---|---|---|---|
| 2024 | $1,009 | $27,970 | $4,170 | $23,800 |
| 2023 | $1,072 | $27,970 | $4,170 | $23,800 |
| 2022 | $783 | $18,520 | $3,590 | $14,930 |
| 2021 | $821 | $18,520 | $3,590 | $14,930 |
| 2020 | $819 | $18,520 | $3,590 | $14,930 |
| 2019 | $1,086 | $15,210 | $3,590 | $11,620 |
| 2018 | $733 | $15,210 | $3,590 | $11,620 |
| 2017 | $342 | $15,210 | $3,590 | $11,620 |
| 2016 | $585 | $13,600 | $3,590 | $10,010 |
| 2015 | $584 | $13,600 | $3,590 | $10,010 |
| 2013 | $602 | $13,600 | $3,590 | $10,010 |
Source: Public Records
Map
Nearby Homes
- 143 W Fancy St
- 308 S Broadway St
- 503 S Broadway St
- 0 Ohio 123 Unit 11 938995
- 0 Ohio 123 Unit 1848086
- 501 S Wright St
- 308 Lazenby St
- 502 Railroad St
- 203 E Main St
- 507 Bourbon St
- 305 E Main St
- 112 W Baldwin St
- 501 E Johns St
- 1 Middleboro Rd
- 117 Pansy Pike
- 157 Pansy Pike
- 7636 Rosewood Dr
- 753 W Main St
- 816 E Center St
- 7403 Fairground Rd
- 130 Central Ave
- 126 Central Ave
- 122 Central Ave
- 134 Central Ave
- 136 Central Ave
- 120 Central Ave
- 129 W Fancy St
- 125 W Fancy St
- 135 W Fancy St
- 131 Central Ave
- 123 W Fancy St
- 127 Central Ave
- 125 Central Ave
- 118 Central Ave
- 121 Central Ave
- 119 W Fancy St
- 137 W Fancy St
- 140 Central Ave
- 114 Central Ave
- 119 Central Ave
Your Personal Tour Guide
Ask me questions while you tour the home.