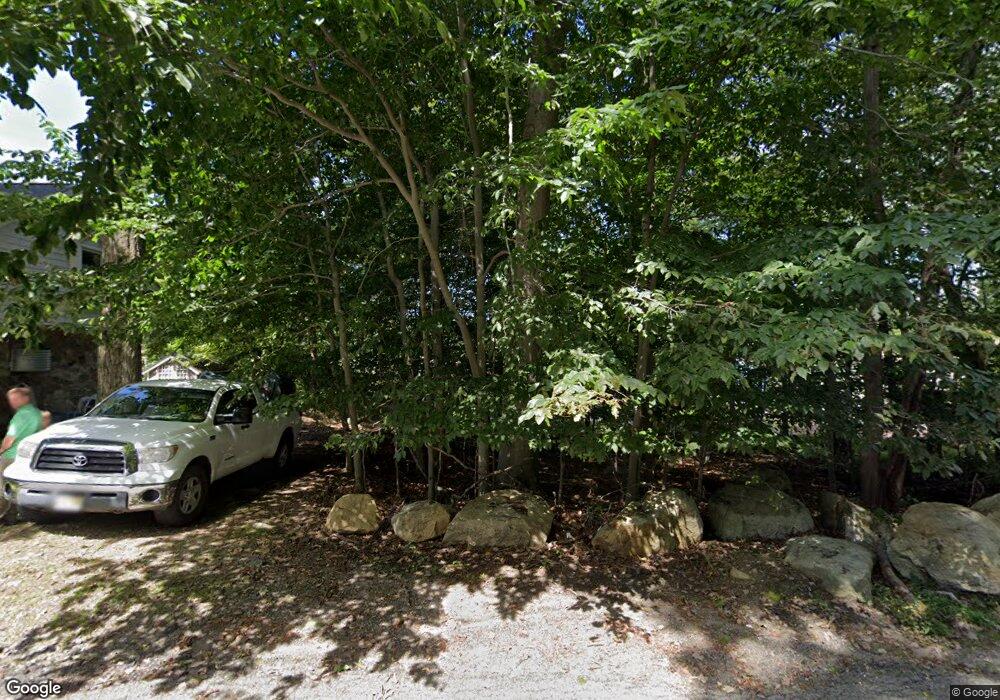
128 Chincopee Rd Unit 1 Lake Hopatcong, NJ 07849
Estimated Value: $1,252,000 - $1,980,000
1
Bed
1
Bath
800
Sq Ft
$2,123/Sq Ft
Est. Value
About This Home
This home is located at 128 Chincopee Rd Unit 1, Lake Hopatcong, NJ 07849 and is currently estimated at $1,698,366, approximately $2,122 per square foot. 128 Chincopee Rd Unit 1 is a home located in Morris County with nearby schools including Jefferson Township Middle School and Jefferson Township High School.
Ownership History
Date
Name
Owned For
Owner Type
Purchase Details
Closed on
Nov 17, 2020
Sold by
Cipolla Naomi F
Bought by
Giardina Joann and Giardina John J
Current Estimated Value
Home Financials for this Owner
Home Financials are based on the most recent Mortgage that was taken out on this home.
Original Mortgage
$530,000
Interest Rate
2.71%
Mortgage Type
New Conventional
Purchase Details
Closed on
Oct 2, 2014
Sold by
Cipolla John J and Cipolla Naomi F
Bought by
Cipolla Naomi F
Purchase Details
Closed on
Apr 3, 2003
Sold by
Copeland Louis
Bought by
Cipolla John and Cipolla Naomi
Purchase Details
Closed on
Aug 21, 2001
Sold by
Klatskin Lynne
Bought by
Copeland Louis
Home Financials for this Owner
Home Financials are based on the most recent Mortgage that was taken out on this home.
Original Mortgage
$145,000
Interest Rate
7.06%
Create a Home Valuation Report for This Property
The Home Valuation Report is an in-depth analysis detailing your home's value as well as a comparison with similar homes in the area
Home Values in the Area
Average Home Value in this Area
Purchase History
| Date | Buyer | Sale Price | Title Company |
|---|---|---|---|
| Giardina Joann | $999,900 | Investment Title | |
| Giardina Joann | $999,900 | Investment Title | |
| Cipolla Naomi F | -- | None Available | |
| Cipolla John | $667,500 | -- | |
| Copeland Louis | $595,000 | -- |
Source: Public Records
Mortgage History
| Date | Status | Borrower | Loan Amount |
|---|---|---|---|
| Previous Owner | Giardina Joann | $530,000 | |
| Previous Owner | Copeland Louis | $145,000 |
Source: Public Records
Tax History Compared to Growth
Tax History
| Year | Tax Paid | Tax Assessment Tax Assessment Total Assessment is a certain percentage of the fair market value that is determined by local assessors to be the total taxable value of land and additions on the property. | Land | Improvement |
|---|---|---|---|---|
| 2025 | $30,710 | $1,109,500 | $478,800 | $630,700 |
| 2024 | $29,933 | $1,023,000 | $478,800 | $544,200 |
| 2023 | $29,933 | $1,023,000 | $478,800 | $544,200 |
| 2022 | $27,856 | $997,000 | $478,800 | $518,200 |
| 2021 | $27,856 | $997,000 | $478,800 | $518,200 |
| 2020 | $27,388 | $997,000 | $478,800 | $518,200 |
| 2019 | $26,918 | $979,200 | $477,400 | $501,800 |
| 2018 | $26,662 | $956,300 | $472,000 | $484,300 |
| 2017 | $27,361 | $964,100 | $501,900 | $462,200 |
| 2016 | $28,073 | $1,044,000 | $575,200 | $468,800 |
| 2015 | $27,679 | $1,005,400 | $575,200 | $430,200 |
| 2014 | $23,775 | $882,300 | $450,400 | $431,900 |
Source: Public Records
Map
Nearby Homes
- 124 Chincopee Rd
- 20 Chincopee Rd
- 315 Lakeside Ave
- 311 Lakeside Ave
- 7 Raccoon Island Rd
- 8 Hopatcong St
- 40 Schwarz Blvd
- 13 Alexandria Ave
- 120 New Jersey Ave
- 00 Forest Rd
- 131 S Maryland Ave
- 221 S Maryland Ave
- 201 S New Jersey Ave
- 49 Northwood Rd
- 145 Schwarz Blvd
- 54 Northwood Rd
- 11 Maine St
- 4 Mohawk Trail
- 221 S New Jersey Ave
- 34 Iowa Ave
- 126 Chincopee Rd
- 138 Chincopee Rd
- 122 Chincopee Rd
- 120 Chincopee Rd
- 143 Chincopee Rd
- 118 Chincopee Rd
- 116 Chincopee Rd
- 114 Chincopee Rd
- 113 Chincopee Rd
- 104 Chincopee Rd
- 111 Chincopee Rd
- 101 Chincopee Rd
- 2 Thompson Ln
- 2 Thompson Ln Unit A
- 4 Thompson Ln
- 6 Thompson Ln
- 330 Lakeside Ave
- 328 Lakeside Ave
- 8 Thompson Ln
- 78 Chincopee Rd