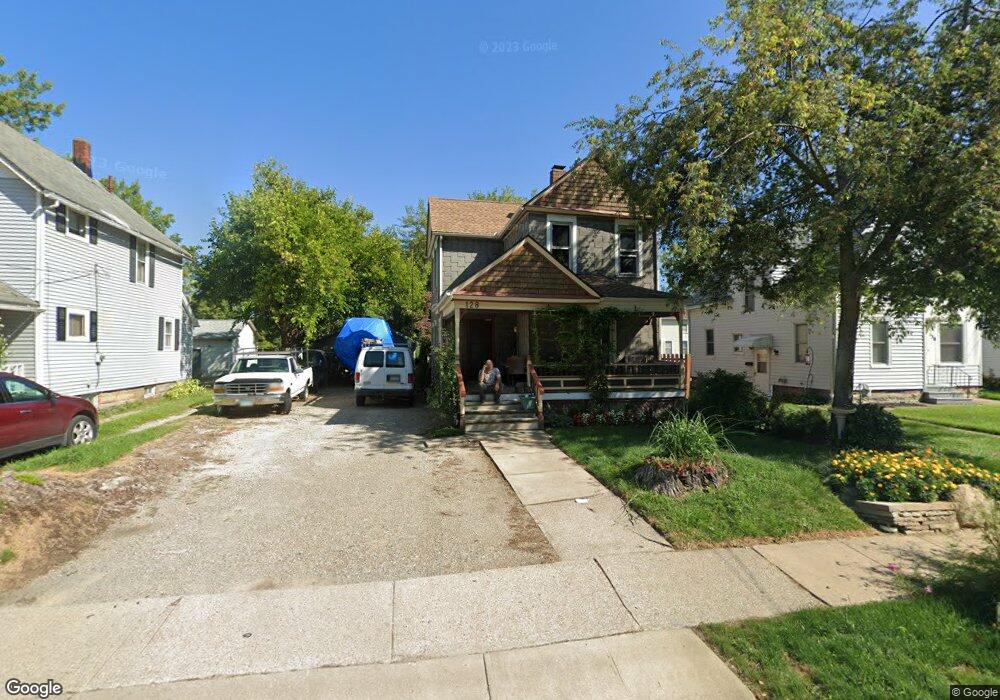
128 Clark St Elyria, OH 44035
Estimated Value: $138,000 - $161,000
3
Beds
1
Bath
1,416
Sq Ft
$107/Sq Ft
Est. Value
About This Home
This home is located at 128 Clark St, Elyria, OH 44035 and is currently estimated at $152,113, approximately $107 per square foot. 128 Clark St is a home located in Lorain County with nearby schools including Eastern Heights Middle School, Elyria High School, and Constellation Schools: Elyria Community Elementary.
Ownership History
Date
Name
Owned For
Owner Type
Purchase Details
Closed on
Jan 23, 2023
Sold by
Ranney Shirley J
Bought by
Torres Nathaniel E
Current Estimated Value
Purchase Details
Closed on
Jan 23, 2008
Sold by
Ranney Shirley J
Bought by
Torres Nathaniel E
Home Financials for this Owner
Home Financials are based on the most recent Mortgage that was taken out on this home.
Original Mortgage
$50,435
Interest Rate
6.1%
Mortgage Type
Seller Take Back
Purchase Details
Closed on
Jul 19, 2006
Sold by
Bozsoki Jeannette and Twiss Altim C
Bought by
Ranney Shirley J
Home Financials for this Owner
Home Financials are based on the most recent Mortgage that was taken out on this home.
Original Mortgage
$51,450
Interest Rate
6.73%
Mortgage Type
Purchase Money Mortgage
Create a Home Valuation Report for This Property
The Home Valuation Report is an in-depth analysis detailing your home's value as well as a comparison with similar homes in the area
Home Values in the Area
Average Home Value in this Area
Purchase History
| Date | Buyer | Sale Price | Title Company |
|---|---|---|---|
| Torres Nathaniel E | $50,500 | None Listed On Document | |
| Torres Nathaniel E | $50,435 | None Available | |
| Ranney Shirley J | $51,500 | None Available |
Source: Public Records
Mortgage History
| Date | Status | Borrower | Loan Amount |
|---|---|---|---|
| Previous Owner | Torres Nathaniel E | $50,435 | |
| Previous Owner | Ranney Shirley J | $51,450 |
Source: Public Records
Tax History
| Year | Tax Paid | Tax Assessment Tax Assessment Total Assessment is a certain percentage of the fair market value that is determined by local assessors to be the total taxable value of land and additions on the property. | Land | Improvement |
|---|---|---|---|---|
| 2024 | $2,061 | $43,197 | $5,828 | $37,370 |
| 2023 | $1,240 | $22,757 | $4,701 | $18,057 |
| 2022 | $1,268 | $22,757 | $4,701 | $18,057 |
| 2021 | $1,239 | $22,757 | $4,701 | $18,057 |
| 2020 | $1,191 | $19,470 | $4,020 | $15,450 |
| 2019 | $1,184 | $19,470 | $4,020 | $15,450 |
| 2018 | $1,230 | $19,470 | $4,020 | $15,450 |
| 2017 | $1,273 | $20,030 | $4,320 | $15,710 |
| 2016 | $1,256 | $20,030 | $4,320 | $15,710 |
| 2015 | $1,177 | $20,030 | $4,320 | $15,710 |
| 2014 | $1,150 | $19,820 | $4,270 | $15,550 |
| 2013 | $1,139 | $19,820 | $4,270 | $15,550 |
Source: Public Records
Map
Nearby Homes
Your Personal Tour Guide
Ask me questions while you tour the home.