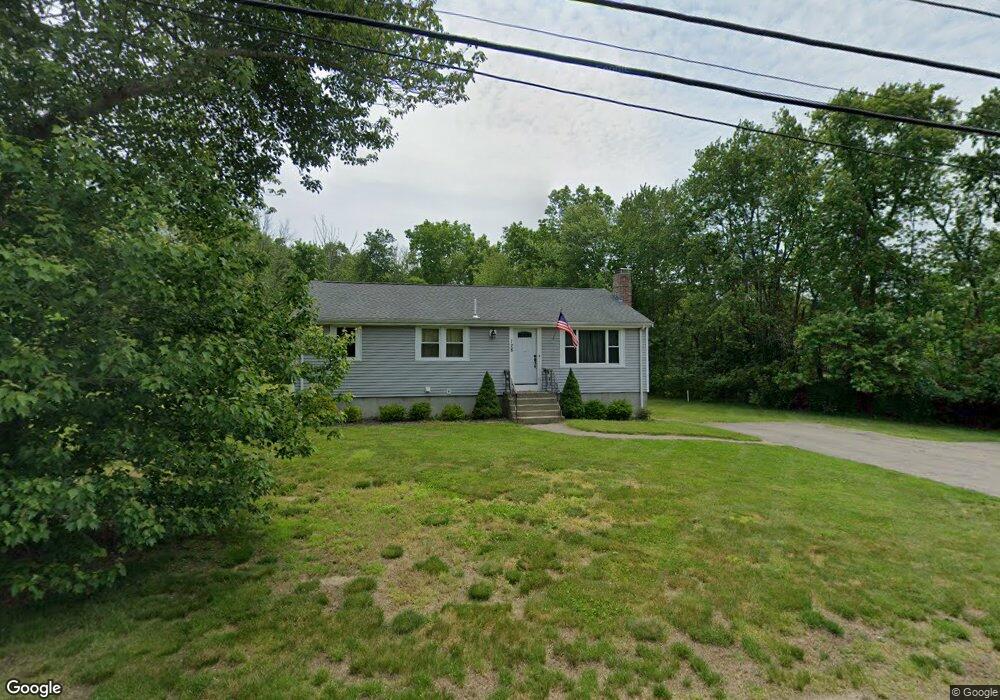
128 Crescent St West Bridgewater, MA 02379
Estimated Value: $429,000 - $571,000
2
Beds
1
Bath
960
Sq Ft
$515/Sq Ft
Est. Value
About This Home
This home is located at 128 Crescent St, West Bridgewater, MA 02379 and is currently estimated at $494,395, approximately $514 per square foot. 128 Crescent St is a home located in Plymouth County with nearby schools including Spring Street Elementary School, Rose L. MacDonald Elementary School, and Howard Elementary School.
Ownership History
Date
Name
Owned For
Owner Type
Purchase Details
Closed on
Jul 3, 2018
Sold by
Natale Robbie B
Bought by
Sullivan Kevin M
Current Estimated Value
Home Financials for this Owner
Home Financials are based on the most recent Mortgage that was taken out on this home.
Original Mortgage
$306,000
Outstanding Balance
$265,781
Interest Rate
4.6%
Mortgage Type
New Conventional
Estimated Equity
$228,614
Purchase Details
Closed on
Mar 29, 2018
Sold by
Baker Christine S Est
Bought by
Natale Robbie B
Purchase Details
Closed on
Dec 31, 1971
Bought by
Baker Shirley C
Create a Home Valuation Report for This Property
The Home Valuation Report is an in-depth analysis detailing your home's value as well as a comparison with similar homes in the area
Home Values in the Area
Average Home Value in this Area
Purchase History
| Date | Buyer | Sale Price | Title Company |
|---|---|---|---|
| Sullivan Kevin M | $344,000 | -- | |
| Natale Robbie B | $170,000 | -- | |
| Baker Shirley C | -- | -- |
Source: Public Records
Mortgage History
| Date | Status | Borrower | Loan Amount |
|---|---|---|---|
| Open | Sullivan Kevin M | $306,000 |
Source: Public Records
Tax History Compared to Growth
Tax History
| Year | Tax Paid | Tax Assessment Tax Assessment Total Assessment is a certain percentage of the fair market value that is determined by local assessors to be the total taxable value of land and additions on the property. | Land | Improvement |
|---|---|---|---|---|
| 2025 | $5,443 | $398,200 | $218,600 | $179,600 |
| 2024 | $5,066 | $357,500 | $198,200 | $159,300 |
| 2023 | $4,843 | $315,100 | $171,600 | $143,500 |
| 2022 | $4,639 | $286,000 | $161,400 | $124,600 |
| 2021 | $4,527 | $270,900 | $161,400 | $109,500 |
| 2020 | $4,381 | $267,600 | $161,400 | $106,200 |
| 2019 | $4,182 | $253,000 | $161,400 | $91,600 |
| 2018 | $4,172 | $235,300 | $153,200 | $82,100 |
| 2017 | $3,817 | $215,300 | $138,900 | $76,400 |
| 2016 | $3,699 | $205,500 | $129,100 | $76,400 |
| 2015 | $3,626 | $203,600 | $129,100 | $74,500 |
| 2014 | $3,311 | $200,800 | $129,100 | $71,700 |
Source: Public Records
Map
Nearby Homes
- 260 Crescent St
- 282 Crescent St
- 122 N Elm St
- 66 Prospect St
- 70 Prospect St
- 29 Ellis Ave
- 6 Maddison
- Lot 1 Jeffrey Ln
- 31 Glenmere St
- 227 S Elm Lot2
- 323 S Elm St
- 92 Bryant St
- 1 Fairway Dr
- 15 Fieldstone Dr
- 37 Metacomet Rd Unit 37
- 58 Metacomet Rd Unit 17
- 13 Finny's Way
- 44 Metacomet Rd Unit 44
- 20 Metacomet Rd Unit 20
- 16 Metacomet Rd Unit 16
- 124 Crescent St
- 141 Crescent St
- 120 Crescent St
- 156 Crescent St
- 117 Crescent St
- 95 Crescent St
- 115 Crescent St
- 96 Crescent St
- Lot B Stoney Rd
- 92 Crescent St
- 93 Crescent St
- 41 Stoney Rd
- 111 Crescent St
- 48 Stoney Rd
- 171 Crescent St
- 2 Pear Tree Ln
- 88 Crescent St
- 39 Stoney Rd
- 179 Crescent St
- 44 Stoney Rd