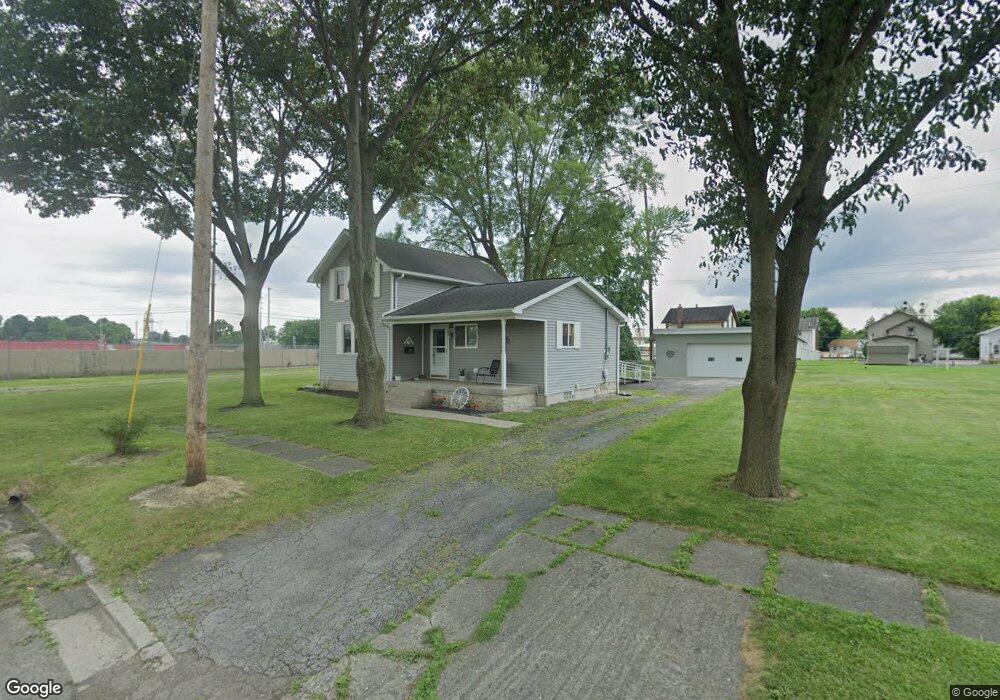
128 East St Bellevue, OH 44811
Estimated Value: $133,000 - $154,682
3
Beds
2
Baths
1,032
Sq Ft
$144/Sq Ft
Est. Value
About This Home
This home is located at 128 East St, Bellevue, OH 44811 and is currently estimated at $148,171, approximately $143 per square foot. 128 East St is a home located in Huron County with nearby schools including Bellevue Elementary School, Bellevue Middle School, and Bellevue High School.
Ownership History
Date
Name
Owned For
Owner Type
Purchase Details
Closed on
Dec 7, 2007
Bought by
Baldwin Steven W & Judy L Or Surv
Current Estimated Value
Purchase Details
Closed on
Nov 27, 2006
Bought by
Freitag David W
Purchase Details
Closed on
Nov 28, 2005
Bought by
Fannie Mae Aka Federal
Purchase Details
Closed on
Mar 22, 2000
Sold by
Burkhart Dennis W
Bought by
Hazelbaker John D
Home Financials for this Owner
Home Financials are based on the most recent Mortgage that was taken out on this home.
Original Mortgage
$42,275
Interest Rate
8.43%
Mortgage Type
New Conventional
Purchase Details
Closed on
Apr 17, 1996
Sold by
Banks Michael S
Bought by
Burkhart Dennis W and Burkhart Traci
Home Financials for this Owner
Home Financials are based on the most recent Mortgage that was taken out on this home.
Original Mortgage
$23,000
Interest Rate
7.44%
Mortgage Type
New Conventional
Create a Home Valuation Report for This Property
The Home Valuation Report is an in-depth analysis detailing your home's value as well as a comparison with similar homes in the area
Home Values in the Area
Average Home Value in this Area
Purchase History
| Date | Buyer | Sale Price | Title Company |
|---|---|---|---|
| Baldwin Steven W & Judy L Or Surv | $95,000 | -- | |
| Freitag David W | $21,500 | -- | |
| Fannie Mae Aka Federal | $36,100 | -- | |
| Hazelbaker John D | $44,500 | -- | |
| Burkhart Dennis W | $23,000 | -- | |
| Banks Michael S | -- | -- |
Source: Public Records
Mortgage History
| Date | Status | Borrower | Loan Amount |
|---|---|---|---|
| Previous Owner | Hazelbaker John D | $42,275 | |
| Previous Owner | Banks Michael S | $23,000 |
Source: Public Records
Tax History Compared to Growth
Tax History
| Year | Tax Paid | Tax Assessment Tax Assessment Total Assessment is a certain percentage of the fair market value that is determined by local assessors to be the total taxable value of land and additions on the property. | Land | Improvement |
|---|---|---|---|---|
| 2024 | $1,208 | $39,500 | $4,440 | $35,060 |
| 2023 | $1,208 | $30,810 | $4,020 | $26,790 |
| 2022 | $951 | $30,810 | $4,020 | $26,790 |
| 2021 | $959 | $30,810 | $4,020 | $26,790 |
| 2020 | $680 | $23,530 | $4,020 | $19,510 |
| 2019 | $670 | $23,530 | $4,020 | $19,510 |
| 2018 | $661 | $23,530 | $4,020 | $19,510 |
| 2017 | $591 | $22,300 | $3,860 | $18,440 |
| 2016 | $576 | $22,300 | $3,860 | $18,440 |
| 2015 | $589 | $22,300 | $3,860 | $18,440 |
| 2014 | $533 | $20,650 | $3,850 | $16,800 |
| 2013 | $527 | $20,650 | $3,850 | $16,800 |
Source: Public Records
Map
Nearby Homes
- 138 High St
- 206 Southwest St
- 140 Harkness St
- 817 E Main St
- 111 Park Ave
- 129 Hamilton St
- 221 Smith Ave
- 155 Ashford Ave
- 408 W Main St
- 231 Lawrence St
- 808 Castalia St
- 7433 County Road 307
- 720 Kilbourne St
- 736 Kilbourne St
- 230 Highland Ave Unit 106
- 118 Maplewood
- 0 Oakwood Dr
- 818 Bellaire Dr
- 803 Del Moy Ave
- 0 Hartland Dr