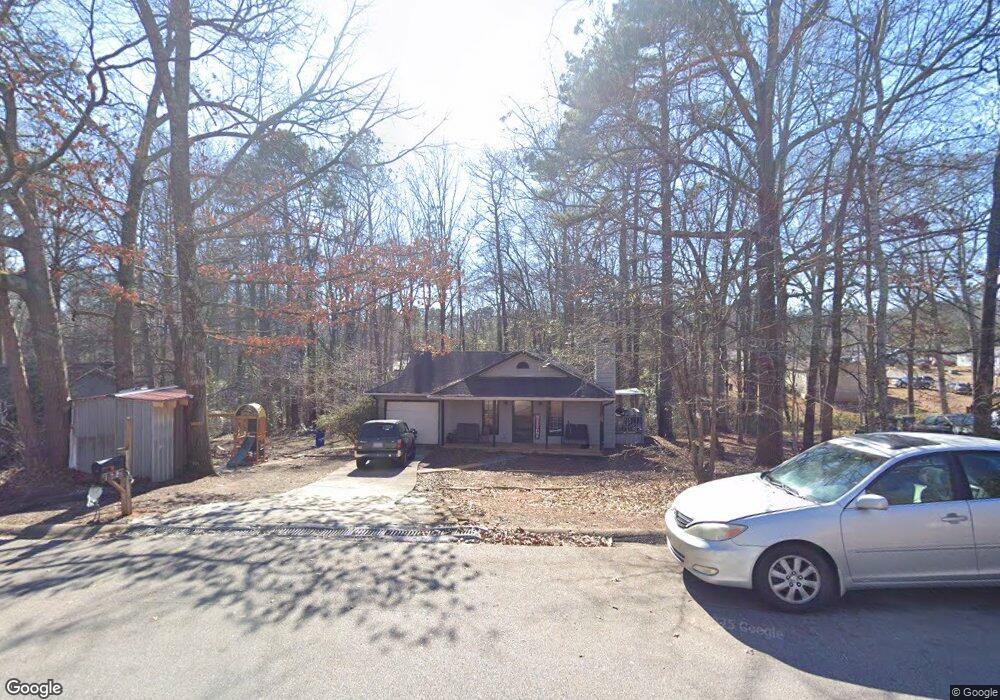
128 Heelstone Ave Bogart, GA 30622
Estimated Value: $218,393 - $252,000
3
Beds
2
Baths
975
Sq Ft
$240/Sq Ft
Est. Value
About This Home
This home is located at 128 Heelstone Ave, Bogart, GA 30622 and is currently estimated at $234,348, approximately $240 per square foot. 128 Heelstone Ave is a home located in Clarke County with nearby schools including Cleveland Road Elementary School, Burney-Harris-Lyons Middle School, and Clarke Central High School.
Ownership History
Date
Name
Owned For
Owner Type
Purchase Details
Closed on
Jun 27, 2006
Sold by
Not Provided
Bought by
Tcm Investments Llc
Current Estimated Value
Purchase Details
Closed on
Aug 1, 2003
Sold by
Todd Garry L and Mahaff Tyler C
Bought by
Ctm Investments Llc
Purchase Details
Closed on
Feb 20, 2001
Sold by
Todd Garry L Chad L Collins
Bought by
Todd Garry L and Mahaffey Tyler C
Purchase Details
Closed on
May 28, 1999
Sold by
Sand Mark L & Jason D Ramsey
Bought by
Todd Garry L Chad L Collins and Todd Tyler
Purchase Details
Closed on
Oct 13, 1998
Sold by
Nationsbanc
Bought by
Sand Mark L & Jason D Ramsey
Purchase Details
Closed on
Feb 3, 1998
Sold by
Johnson Paula Y
Bought by
Nationsbanc
Purchase Details
Closed on
Jul 13, 1994
Sold by
Newport Development Corporation
Bought by
Johnson Paula Y
Purchase Details
Closed on
Oct 28, 1992
Sold by
Goodman Jim
Bought by
Newport Development Corporation
Create a Home Valuation Report for This Property
The Home Valuation Report is an in-depth analysis detailing your home's value as well as a comparison with similar homes in the area
Home Values in the Area
Average Home Value in this Area
Purchase History
| Date | Buyer | Sale Price | Title Company |
|---|---|---|---|
| Tcm Investments Llc | -- | -- | |
| Ctm Investments Llc | -- | -- | |
| Todd Garry L | -- | -- | |
| Todd Garry L Chad L Collins | $58,500 | -- | |
| Sand Mark L & Jason D Ramsey | $47,000 | -- | |
| Nationsbanc | $45,000 | -- | |
| Johnson Paula Y | $56,900 | -- | |
| Newport Development Corporation | $7,500 | -- |
Source: Public Records
Tax History Compared to Growth
Tax History
| Year | Tax Paid | Tax Assessment Tax Assessment Total Assessment is a certain percentage of the fair market value that is determined by local assessors to be the total taxable value of land and additions on the property. | Land | Improvement |
|---|---|---|---|---|
| 2025 | $1,653 | $53,232 | $12,000 | $41,232 |
| 2024 | $1,653 | $50,354 | $12,000 | $38,354 |
| 2023 | $1,574 | $42,905 | $10,400 | $32,505 |
| 2022 | $1,175 | $36,827 | $10,400 | $26,427 |
| 2021 | $1,029 | $30,526 | $5,600 | $24,926 |
| 2020 | $993 | $29,465 | $5,600 | $23,865 |
| 2019 | $942 | $27,740 | $5,600 | $22,140 |
| 2018 | $915 | $26,957 | $4,800 | $22,157 |
| 2017 | $816 | $24,033 | $4,800 | $19,233 |
| 2016 | $744 | $21,905 | $4,800 | $17,105 |
| 2015 | $676 | $19,867 | $4,800 | $15,067 |
| 2014 | $683 | $20,061 | $4,800 | $15,261 |
Source: Public Records
Map
Nearby Homes
- 130 Heelstone Ave
- 0 Heelstone Ave
- 115 Marlborough Downs Rd Unit Lot 13
- 115 Marlborough Downs Rd Unit 10
- 105 Salisbury Plain Dr
- 115 Salisbury Plain Dr
- 120 Heelstone Ave
- 140 Heelstone Ave
- 155 Heelstone Ave
- 105 Heelstone Place
- 119 Marlborough Downs Rd
- 119 Marlborough Downs Rd Unit Lot 12
- 119 Marlborough Downs Rd
- 125 Marlborough Downs Rd
- 125 Salisbury Plain Dr Unit 1
- 125 Salisbury Plain Dr
- 100 Heelstone Place
- 0 Heelstone Place Unit 8568133
- 0 Heelstone Place Unit 8172060
- 0 Heelstone Place Unit 8172055