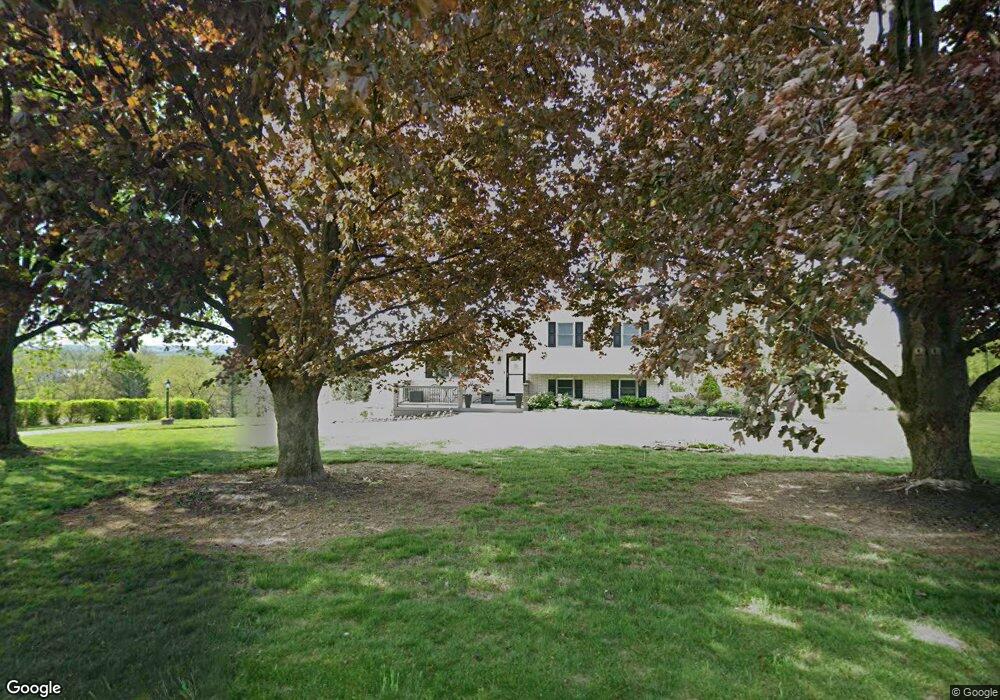
128 Hepner Rd Hamburg, PA 19526
Estimated Value: $360,000 - $415,000
3
Beds
3
Baths
2,199
Sq Ft
$176/Sq Ft
Est. Value
About This Home
This home is located at 128 Hepner Rd, Hamburg, PA 19526 and is currently estimated at $387,567, approximately $176 per square foot. 128 Hepner Rd is a home located in Berks County with nearby schools including Hamburg Area High School.
Ownership History
Date
Name
Owned For
Owner Type
Purchase Details
Closed on
Aug 18, 2006
Sold by
Mest David M and Mest Deborah L
Bought by
Witkus Christopher M and Witkus Bobbie J
Current Estimated Value
Home Financials for this Owner
Home Financials are based on the most recent Mortgage that was taken out on this home.
Original Mortgage
$20,500
Outstanding Balance
$12,418
Interest Rate
6.83%
Mortgage Type
Stand Alone Second
Estimated Equity
$375,149
Purchase Details
Closed on
Dec 10, 2002
Sold by
Mest David M and Mest Deborah L
Bought by
Mest David M and Mest Deborah L
Home Financials for this Owner
Home Financials are based on the most recent Mortgage that was taken out on this home.
Original Mortgage
$116,000
Interest Rate
5.51%
Create a Home Valuation Report for This Property
The Home Valuation Report is an in-depth analysis detailing your home's value as well as a comparison with similar homes in the area
Home Values in the Area
Average Home Value in this Area
Purchase History
| Date | Buyer | Sale Price | Title Company |
|---|---|---|---|
| Witkus Christopher M | $205,000 | None Available | |
| Mest David M | -- | First American Title Ins Co |
Source: Public Records
Mortgage History
| Date | Status | Borrower | Loan Amount |
|---|---|---|---|
| Open | Witkus Christopher M | $20,500 | |
| Open | Witkus Christopher M | $164,000 | |
| Previous Owner | Mest David M | $116,000 |
Source: Public Records
Tax History Compared to Growth
Tax History
| Year | Tax Paid | Tax Assessment Tax Assessment Total Assessment is a certain percentage of the fair market value that is determined by local assessors to be the total taxable value of land and additions on the property. | Land | Improvement |
|---|---|---|---|---|
| 2025 | $1,298 | $135,000 | $30,000 | $105,000 |
| 2024 | $4,807 | $135,000 | $30,000 | $105,000 |
| 2023 | $5,556 | $135,000 | $30,000 | $105,000 |
| 2022 | $4,714 | $135,000 | $30,000 | $105,000 |
| 2021 | $4,714 | $135,000 | $30,000 | $105,000 |
| 2020 | $3,775 | $108,100 | $30,000 | $78,100 |
| 2019 | $3,775 | $108,100 | $30,000 | $78,100 |
| 2018 | $3,775 | $108,100 | $30,000 | $78,100 |
| 2017 | $3,717 | $108,100 | $30,000 | $78,100 |
| 2016 | $813 | $108,100 | $30,000 | $78,100 |
| 2015 | $813 | $108,100 | $30,000 | $78,100 |
| 2014 | $813 | $108,100 | $30,000 | $78,100 |
Source: Public Records
Map
Nearby Homes