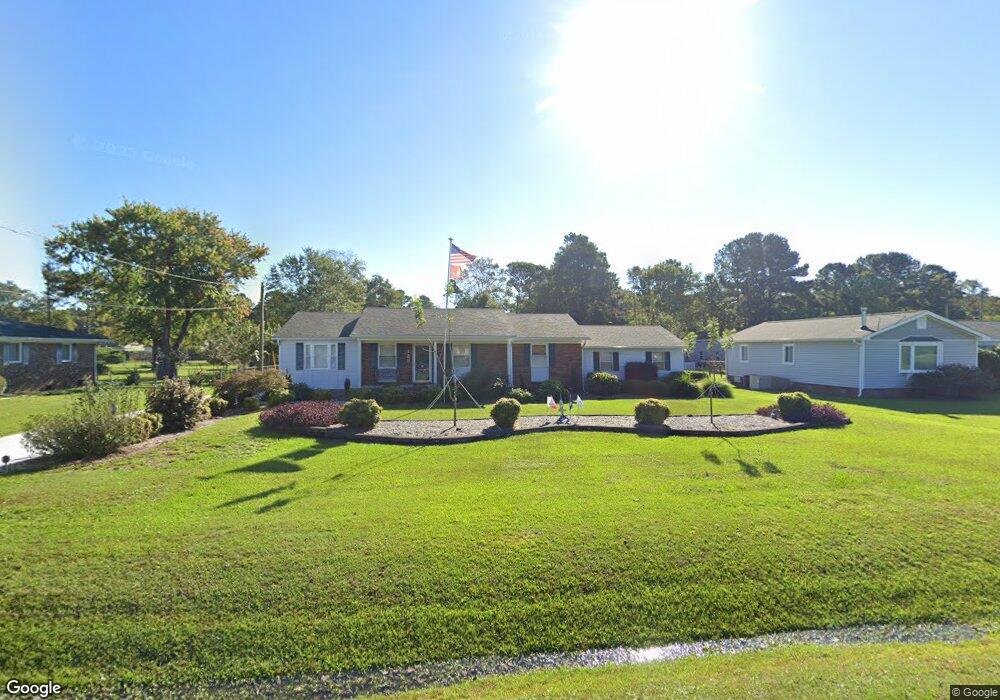
128 Horndale Dr Wilmington, NC 28409
Estimated Value: $363,000 - $477,000
3
Beds
3
Baths
1,440
Sq Ft
$294/Sq Ft
Est. Value
About This Home
This home is located at 128 Horndale Dr, Wilmington, NC 28409 and is currently estimated at $423,989, approximately $294 per square foot. 128 Horndale Dr is a home located in New Hanover County with nearby schools including Heyward C. Bellamy Elementary School, Myrtle Grove Middle School, and Eugene Ashley High School.
Ownership History
Date
Name
Owned For
Owner Type
Purchase Details
Closed on
Sep 16, 2014
Sold by
Poraczky Herbert John and Poraczky Karen Hill
Bought by
Poraczky Herbert John and Poraczky Karen Hill
Current Estimated Value
Home Financials for this Owner
Home Financials are based on the most recent Mortgage that was taken out on this home.
Original Mortgage
$143,500
Outstanding Balance
$47,462
Interest Rate
4.2%
Mortgage Type
VA
Estimated Equity
$376,527
Purchase Details
Closed on
Aug 2, 1996
Sold by
Allen Donna Cox
Bought by
Poraczky Herbert John Karen H
Purchase Details
Closed on
Oct 22, 1992
Sold by
Fox Lloyd Wm Rosemary F
Bought by
Poraczky Herbert John Karen H
Purchase Details
Closed on
Jun 1, 1987
Sold by
Reese James R Jr Lillian
Bought by
Fox Lloyd Wm Rosemary F
Purchase Details
Closed on
Mar 1, 1978
Bought by
Reese James R Jr Lillian
Create a Home Valuation Report for This Property
The Home Valuation Report is an in-depth analysis detailing your home's value as well as a comparison with similar homes in the area
Home Values in the Area
Average Home Value in this Area
Purchase History
| Date | Buyer | Sale Price | Title Company |
|---|---|---|---|
| Poraczky Herbert John | -- | None Available | |
| Poraczky Herbert John Karen H | $2,000 | -- | |
| Poraczky Herbert John Karen H | $82,000 | -- | |
| Fox Lloyd Wm Rosemary F | $45,000 | -- | |
| Reese James R Jr Lillian | $25,000 | -- |
Source: Public Records
Mortgage History
| Date | Status | Borrower | Loan Amount |
|---|---|---|---|
| Open | Poraczky Herbert John | $143,500 |
Source: Public Records
Tax History Compared to Growth
Tax History
| Year | Tax Paid | Tax Assessment Tax Assessment Total Assessment is a certain percentage of the fair market value that is determined by local assessors to be the total taxable value of land and additions on the property. | Land | Improvement |
|---|---|---|---|---|
| 2025 | $2,082 | $530,700 | $146,400 | $384,300 |
| 2023 | $1,724 | $315,800 | $88,900 | $226,900 |
| 2022 | $1,734 | $315,800 | $88,900 | $226,900 |
| 2021 | $1,741 | $315,800 | $88,900 | $226,900 |
| 2020 | $1,223 | $193,400 | $44,600 | $148,800 |
| 2019 | $1,223 | $193,400 | $44,600 | $148,800 |
| 2018 | $1,223 | $193,400 | $44,600 | $148,800 |
| 2017 | $1,252 | $193,400 | $44,600 | $148,800 |
| 2016 | $1,248 | $180,100 | $44,600 | $135,500 |
| 2015 | $1,160 | $180,100 | $44,600 | $135,500 |
| 2014 | $1,140 | $180,100 | $44,600 | $135,500 |
Source: Public Records
Map
Nearby Homes
- 234 Brighton Rd
- 5109 Old Myrtle Grove Rd
- 5014 Helms Port Ave
- 4820 W Grove Dr
- 5353 Leisure Cir
- 5225 Leisure Cir
- 5705 Woodduck Cir
- 1202 Beresford Ct
- 5418 Saltwater Run
- 633 Piner Rd
- 273 Foxwood Ln
- 301 Foxwood Ln
- 5500 N Warrendale Ct
- 5205 Helms Port Ave
- 5010 Dockside Dr
- 5232 Masonboro Harbour
- 222 Sea Gull Ln
- 5017 Dockside Dr
- 5200 Woods Edge Rd
- 5028 Laurenbridge Ln
- 124 Horndale Dr
- 132 Horndale Dr
- 120 Horndale Dr
- 101 Colchester Place
- 105 Colchester Place
- 136 Horndale Dr
- 109 Colchester Place
- 111 Colchester Place
- 116 Horndale Dr
- 127 Horndale Dr
- 131 Horndale Dr
- 123 Horndale Dr
- 113 Colchester Place
- 140 Horndale Dr
- 135 Horndale Dr
- 119 Horndale Dr
- 117 Colchester Place
- 112 Horndale Dr
- 102 Colchester Place
- 139 Horndale Dr