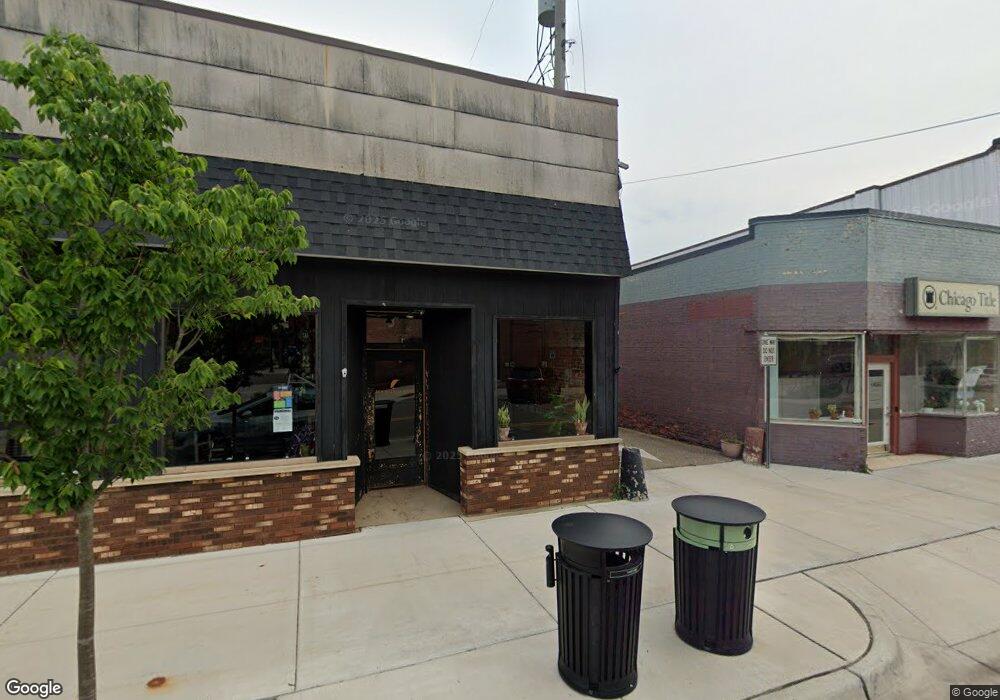
128 Hubbard St Allegan, MI 49010
Estimated Value: $191,458
--
Bed
--
Bath
6,809
Sq Ft
$28/Sq Ft
Est. Value
About This Home
This home is located at 128 Hubbard St, Allegan, MI 49010 and is currently estimated at $191,458, approximately $28 per square foot. 128 Hubbard St is a home located in Allegan County with nearby schools including North Ward Elementary School, L.E. White Middle School, and Allegan High School.
Ownership History
Date
Name
Owned For
Owner Type
Purchase Details
Closed on
Apr 30, 1998
Sold by
Olcott Vernon C and Olcott Bonnie J
Bought by
Morris-Villar Properties Llc
Current Estimated Value
Purchase Details
Closed on
Apr 17, 1998
Sold by
Olcott Vernon C and Olcott Bonnie J
Bought by
Morris-Villar Properties Llc
Purchase Details
Closed on
Nov 30, 1997
Sold by
Olcott Vernon C and Olcott Bonnie J
Bought by
Morris-Villar Properties
Purchase Details
Closed on
Nov 26, 1997
Sold by
Olcott Vernon C and Olcott Bonnie J
Bought by
Morris-Villar Properties
Create a Home Valuation Report for This Property
The Home Valuation Report is an in-depth analysis detailing your home's value as well as a comparison with similar homes in the area
Home Values in the Area
Average Home Value in this Area
Purchase History
| Date | Buyer | Sale Price | Title Company |
|---|---|---|---|
| Morris-Villar Properties Llc | $45,000 | -- | |
| Morris-Villar Properties Llc | $45,000 | -- | |
| Morris-Villar Properties | $45,000 | -- | |
| Morris-Villar Properties | $45,000 | -- |
Source: Public Records
Tax History Compared to Growth
Tax History
| Year | Tax Paid | Tax Assessment Tax Assessment Total Assessment is a certain percentage of the fair market value that is determined by local assessors to be the total taxable value of land and additions on the property. | Land | Improvement |
|---|---|---|---|---|
| 2025 | $4,480 | $133,600 | $10,800 | $122,800 |
| 2024 | $4,073 | $114,100 | $11,200 | $102,900 |
| 2023 | $4,207 | $104,500 | $9,400 | $95,100 |
| 2022 | $4,073 | $94,900 | $6,900 | $88,000 |
| 2021 | $3,908 | $95,100 | $5,500 | $89,600 |
| 2020 | $3,852 | $91,800 | $6,200 | $85,600 |
| 2019 | $3,764 | $94,900 | $8,900 | $86,000 |
| 2018 | $3,617 | $81,600 | $8,900 | $72,700 |
| 2017 | $0 | $76,200 | $9,900 | $66,300 |
| 2016 | $0 | $75,400 | $7,500 | $67,900 |
| 2015 | -- | $75,400 | $7,500 | $67,900 |
| 2014 | -- | $83,300 | $7,500 | $75,800 |
| 2013 | $3,115 | $79,300 | $5,800 | $73,500 |
Source: Public Records
Map
Nearby Homes