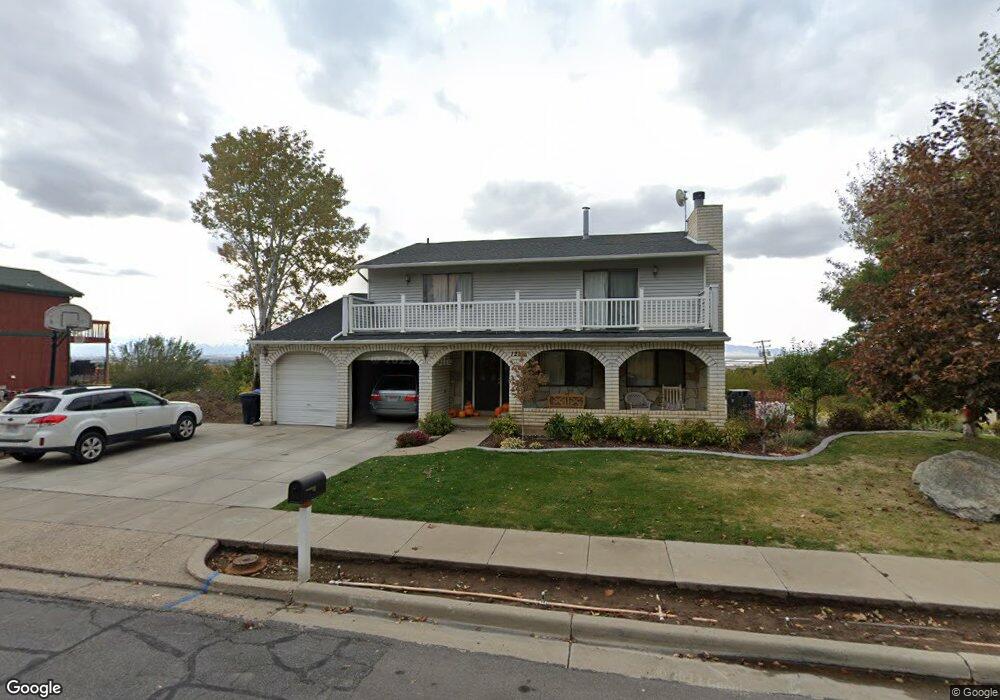
128 Island View Dr Centerville, UT 84014
Estimated Value: $699,000 - $907,000
5
Beds
4
Baths
4,390
Sq Ft
$184/Sq Ft
Est. Value
About This Home
This home is located at 128 Island View Dr, Centerville, UT 84014 and is currently estimated at $807,524, approximately $183 per square foot. 128 Island View Dr is a home located in Davis County with nearby schools including J A Taylor Elementary School, Centerville Jr High, and Viewmont High School.
Ownership History
Date
Name
Owned For
Owner Type
Purchase Details
Closed on
Dec 20, 2012
Sold by
Nickolaisen Niel R and Nickolaisen Karen L
Bought by
Marshall Ladd
Current Estimated Value
Home Financials for this Owner
Home Financials are based on the most recent Mortgage that was taken out on this home.
Original Mortgage
$230,840
Outstanding Balance
$159,934
Interest Rate
3.37%
Mortgage Type
New Conventional
Estimated Equity
$647,590
Create a Home Valuation Report for This Property
The Home Valuation Report is an in-depth analysis detailing your home's value as well as a comparison with similar homes in the area
Home Values in the Area
Average Home Value in this Area
Purchase History
| Date | Buyer | Sale Price | Title Company |
|---|---|---|---|
| Marshall Ladd | -- | United Title Services |
Source: Public Records
Mortgage History
| Date | Status | Borrower | Loan Amount |
|---|---|---|---|
| Open | Marshall Ladd | $230,840 |
Source: Public Records
Tax History Compared to Growth
Tax History
| Year | Tax Paid | Tax Assessment Tax Assessment Total Assessment is a certain percentage of the fair market value that is determined by local assessors to be the total taxable value of land and additions on the property. | Land | Improvement |
|---|---|---|---|---|
| 2025 | $4,404 | $421,300 | $179,243 | $242,057 |
| 2024 | $4,099 | $398,750 | $165,235 | $233,515 |
| 2023 | $3,891 | $684,000 | $265,610 | $418,390 |
| 2022 | $4,130 | $399,850 | $135,219 | $264,631 |
| 2021 | $3,850 | $559,000 | $212,593 | $346,407 |
| 2020 | $3,151 | $475,000 | $204,499 | $270,501 |
| 2019 | $3,192 | $470,000 | $194,729 | $275,271 |
| 2018 | $2,970 | $432,000 | $180,141 | $251,859 |
| 2016 | $2,631 | $208,230 | $66,355 | $141,875 |
| 2015 | $2,506 | $191,125 | $66,355 | $124,770 |
| 2014 | $2,397 | $178,484 | $66,355 | $112,129 |
| 2013 | -- | $174,752 | $53,633 | $121,119 |
Source: Public Records
Map
Nearby Homes