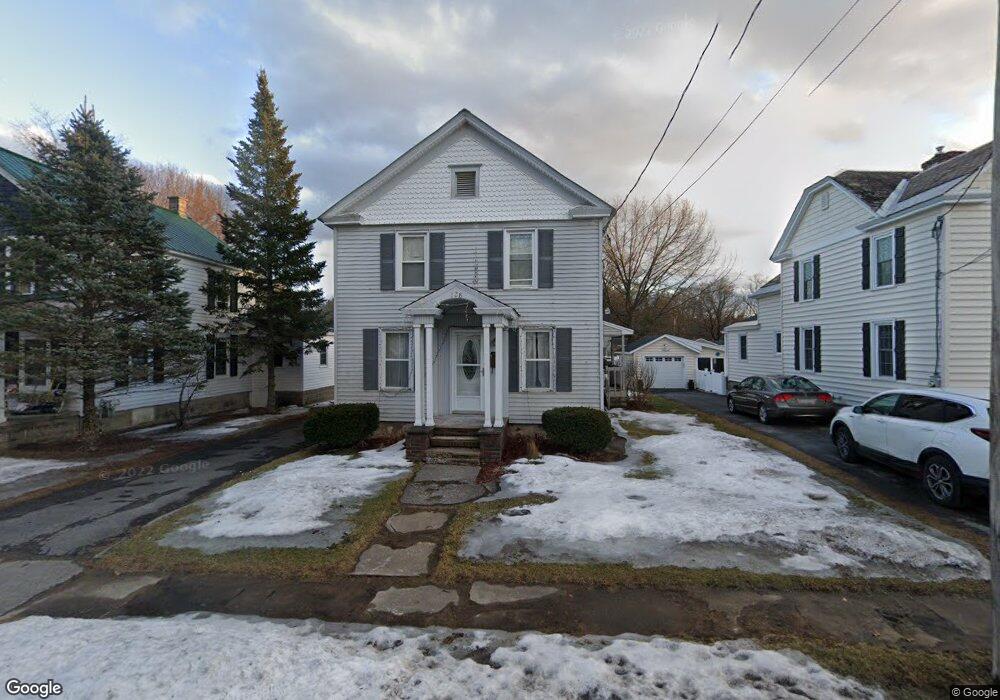
128 John St Hudson Falls, NY 12839
Estimated Value: $181,000 - $222,000
3
Beds
1
Bath
1,339
Sq Ft
$154/Sq Ft
Est. Value
About This Home
This home is located at 128 John St, Hudson Falls, NY 12839 and is currently estimated at $206,329, approximately $154 per square foot. 128 John St is a home located in Washington County with nearby schools including Margaret Murphy Kindergarten Center, Hudson Falls Intermediate School, and Hudson Falls Primary School.
Ownership History
Date
Name
Owned For
Owner Type
Purchase Details
Closed on
Dec 7, 2015
Sold by
Parrott Donald
Bought by
Dingmon Amie
Current Estimated Value
Purchase Details
Closed on
Dec 1, 2006
Sold by
Tirelli Louis
Bought by
Dingmon Amie
Home Financials for this Owner
Home Financials are based on the most recent Mortgage that was taken out on this home.
Original Mortgage
$22,300
Interest Rate
6.4%
Mortgage Type
Unknown
Purchase Details
Closed on
Jun 26, 2000
Sold by
Joan Conlee Mary
Bought by
Tirelli Louis J
Purchase Details
Closed on
Nov 6, 1998
Purchase Details
Closed on
Jan 21, 1997
Create a Home Valuation Report for This Property
The Home Valuation Report is an in-depth analysis detailing your home's value as well as a comparison with similar homes in the area
Home Values in the Area
Average Home Value in this Area
Purchase History
| Date | Buyer | Sale Price | Title Company |
|---|---|---|---|
| Dingmon Amie | $5,000 | -- | |
| Dingmon Amie | $111,300 | Christopher Watt | |
| Tirelli Louis J | $55,000 | None | |
| -- | -- | -- | |
| -- | -- | -- |
Source: Public Records
Mortgage History
| Date | Status | Borrower | Loan Amount |
|---|---|---|---|
| Previous Owner | Dingmon Amie | $22,300 | |
| Previous Owner | Dingmon Amie | $89,000 |
Source: Public Records
Tax History
| Year | Tax Paid | Tax Assessment Tax Assessment Total Assessment is a certain percentage of the fair market value that is determined by local assessors to be the total taxable value of land and additions on the property. | Land | Improvement |
|---|---|---|---|---|
| 2024 | $5,055 | $199,400 | $10,500 | $188,900 |
| 2023 | $4,679 | $174,900 | $10,500 | $164,400 |
| 2022 | $4,450 | $165,000 | $10,500 | $154,500 |
| 2021 | $4,051 | $148,200 | $10,500 | $137,700 |
| 2020 | $2,865 | $109,000 | $10,500 | $98,500 |
| 2019 | $3,018 | $109,000 | $10,500 | $98,500 |
| 2018 | $3,018 | $109,000 | $10,500 | $98,500 |
| 2017 | $3,071 | $116,800 | $10,500 | $106,300 |
| 2016 | $2,932 | $109,600 | $10,500 | $99,100 |
| 2015 | -- | $111,800 | $9,800 | $102,000 |
| 2014 | -- | $112,500 | $9,800 | $102,700 |
Source: Public Records
Map
Nearby Homes
Your Personal Tour Guide
Ask me questions while you tour the home.