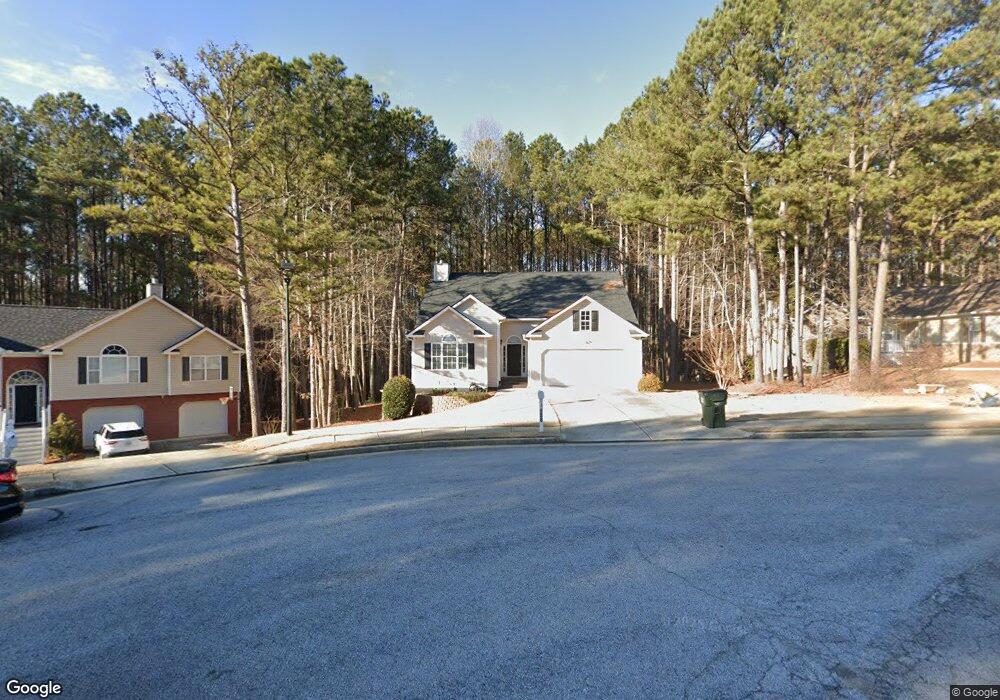
128 Joshua Ln Unit 39 Dallas, GA 30132
East Paulding County NeighborhoodEstimated Value: $347,399 - $366,000
3
Beds
2
Baths
1,604
Sq Ft
$221/Sq Ft
Est. Value
About This Home
This home is located at 128 Joshua Ln Unit 39, Dallas, GA 30132 and is currently estimated at $354,100, approximately $220 per square foot. 128 Joshua Ln Unit 39 is a home located in Paulding County with nearby schools including W.C. Abney Elementary School, Lena Mae Moses Middle School, and North Paulding High School.
Ownership History
Date
Name
Owned For
Owner Type
Purchase Details
Closed on
May 1, 2014
Sold by
Mann Kathryn S
Bought by
Tillberry Mary
Current Estimated Value
Home Financials for this Owner
Home Financials are based on the most recent Mortgage that was taken out on this home.
Original Mortgage
$141,455
Outstanding Balance
$108,247
Interest Rate
4.44%
Mortgage Type
New Conventional
Estimated Equity
$245,853
Purchase Details
Closed on
Feb 28, 2014
Sold by
Mann Kenneth E
Bought by
Mann Kathryn S
Purchase Details
Closed on
Apr 18, 2013
Sold by
Mann Kathryn S
Bought by
Mann Kenneth E and Mann Dana S
Purchase Details
Closed on
Sep 9, 2011
Sold by
Citimortgage Inc
Bought by
Mann Kathryn S
Purchase Details
Closed on
Jun 7, 2011
Sold by
Pierce James A and Pierce Valerie A
Bought by
Citimortgage
Purchase Details
Closed on
Nov 14, 2003
Sold by
Harvester Homes Inc
Home Financials for this Owner
Home Financials are based on the most recent Mortgage that was taken out on this home.
Original Mortgage
$31,153
Interest Rate
6.04%
Mortgage Type
New Conventional
Create a Home Valuation Report for This Property
The Home Valuation Report is an in-depth analysis detailing your home's value as well as a comparison with similar homes in the area
Home Values in the Area
Average Home Value in this Area
Purchase History
| Date | Buyer | Sale Price | Title Company |
|---|---|---|---|
| Tillberry Mary | $148,900 | -- | |
| Mann Kathryn S | -- | -- | |
| Mann Kenneth E | -- | -- | |
| Mann Kathryn S | $72,100 | -- | |
| Citimortgage | -- | -- | |
| -- | $155,800 | -- |
Source: Public Records
Mortgage History
| Date | Status | Borrower | Loan Amount |
|---|---|---|---|
| Open | Tillberry Mary | $141,455 | |
| Previous Owner | -- | $31,153 |
Source: Public Records
Tax History Compared to Growth
Tax History
| Year | Tax Paid | Tax Assessment Tax Assessment Total Assessment is a certain percentage of the fair market value that is determined by local assessors to be the total taxable value of land and additions on the property. | Land | Improvement |
|---|---|---|---|---|
| 2024 | $3,116 | $128,496 | $14,000 | $114,496 |
| 2023 | $3,144 | $123,112 | $14,000 | $109,112 |
| 2022 | $2,847 | $111,088 | $14,000 | $97,088 |
| 2021 | $2,548 | $89,528 | $14,000 | $75,528 |
| 2020 | $2,471 | $85,040 | $12,000 | $73,040 |
| 2019 | $2,358 | $80,120 | $12,000 | $68,120 |
| 2018 | $2,003 | $68,360 | $10,000 | $58,360 |
| 2017 | $1,914 | $64,520 | $8,000 | $56,520 |
| 2016 | $1,822 | $62,120 | $8,000 | $54,120 |
| 2015 | $1,767 | $59,280 | $8,000 | $51,280 |
| 2014 | $1,499 | $49,360 | $8,000 | $41,360 |
| 2013 | -- | $43,600 | $8,000 | $35,600 |
Source: Public Records
Map
Nearby Homes
- 261 Westridge Cir
- 251 Eagle Lake Dr
- 93 Wolfridge Ct
- 30 Rivulet Dr
- 359 Westridge Cir
- 601 Victoria Heights Dr
- FLORA Plan at Thompson Ridge
- HALTON Plan at Thompson Ridge
- MANSFIELD Plan at Thompson Ridge
- GALEN Plan at Thompson Ridge
- HAYDEN Plan at Thompson Ridge
- HANOVER Plan at Thompson Ridge
- 295 Springer Pkwy
- 125 Misty Lea Dr
- 190 Brasstown Dr
- 24 Cannon Ridge View
- 176 Deven Dr
- 154 Deven Dr
- 761 Victoria Heights Dr
- 128 Joshua Ln
- 134 Joshua Ln
- 112 Joshua Ln
- 133 Joshua Ln
- 94 Joshua Ln
- 0 Kessle Ln Unit 3258211
- 0 Kessle Ln Unit 8765681
- 0 Kessle Ln Unit 8661824
- 0 Kessle Ln Unit 8244963
- 0 Kessle Ln Unit 8198001
- 0 Kessle Ln Unit 3150130
- 0 Kessle Ln Unit 8404890
- 0 Kessle Ln Unit 7253660
- 0 Kessle Ln
- 111 Joshua Ln
- 131 Joshua Ln Unit Ga1431
- 131 Joshua Ln
- 131 Joshua Ln Unit GA14318
- 74 Joshua Ln
- 76 Kessle Ln