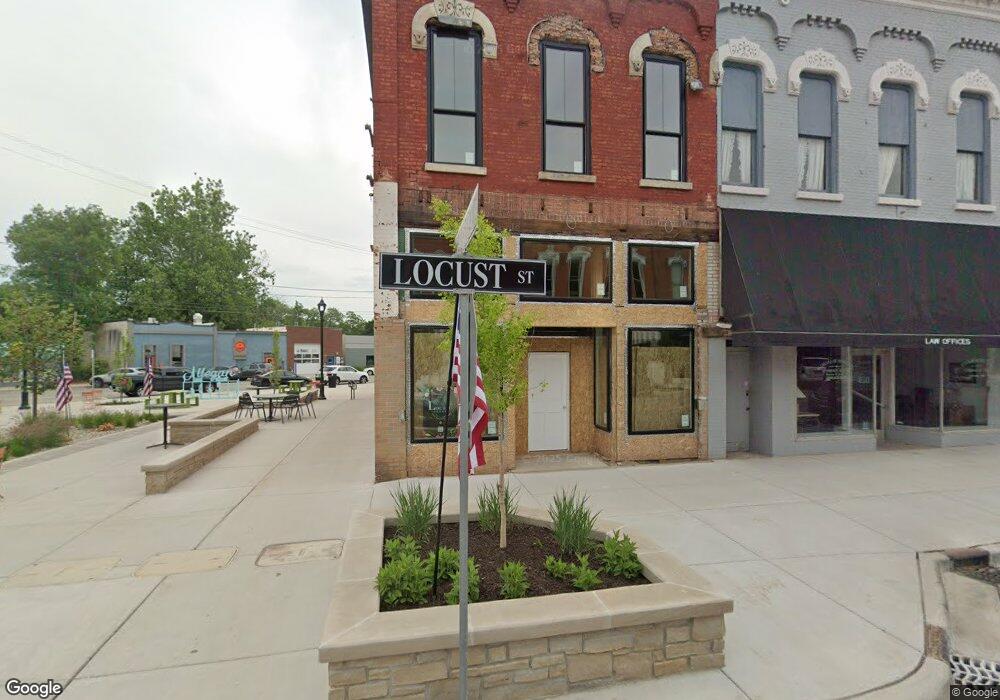
128 Locust St Allegan, MI 49010
Estimated Value: $176,015
--
Bed
1
Bath
3,600
Sq Ft
$49/Sq Ft
Est. Value
About This Home
This home is located at 128 Locust St, Allegan, MI 49010 and is currently priced at $176,015, approximately $48 per square foot. 128 Locust St is a home located in Allegan County with nearby schools including North Ward Elementary School, L.E. White Middle School, and Allegan High School.
Ownership History
Date
Name
Owned For
Owner Type
Purchase Details
Closed on
Apr 17, 2020
Sold by
Kerstra Ronald J and Kerstra Debra S
Bought by
Dewey Family Properties Llc
Current Estimated Value
Purchase Details
Closed on
May 15, 2007
Sold by
Shoreline Insurance Services Inc
Bought by
Kerkstra Ronald Jay and Kerkstra Debra Sue
Purchase Details
Closed on
Feb 22, 2001
Sold by
Shoreline Bank
Bought by
Shoreline Insurance Services Inc
Create a Home Valuation Report for This Property
The Home Valuation Report is an in-depth analysis detailing your home's value as well as a comparison with similar homes in the area
Home Values in the Area
Average Home Value in this Area
Purchase History
| Date | Buyer | Sale Price | Title Company |
|---|---|---|---|
| Dewey Family Properties Llc | -- | Chicago Title Of Mi Inc | |
| Kerkstra Ronald Jay | $100,000 | Chicago Title Allegan | |
| Shoreline Insurance Services Inc | -- | -- |
Source: Public Records
Tax History Compared to Growth
Tax History
| Year | Tax Paid | Tax Assessment Tax Assessment Total Assessment is a certain percentage of the fair market value that is determined by local assessors to be the total taxable value of land and additions on the property. | Land | Improvement |
|---|---|---|---|---|
| 2025 | $373 | $6,800 | $6,800 | $0 |
| 2024 | $2,332 | $7,000 | $7,000 | $0 |
| 2023 | $2,409 | $40,600 | $5,900 | $34,700 |
| 2022 | $2,332 | $36,900 | $4,300 | $32,600 |
| 2021 | $3,508 | $56,000 | $3,400 | $52,600 |
| 2020 | $2,955 | $54,100 | $3,900 | $50,200 |
| 2019 | $2,887 | $56,000 | $5,600 | $50,400 |
| 2018 | $2,774 | $48,600 | $5,600 | $43,000 |
| 2017 | $0 | $45,400 | $6,200 | $39,200 |
| 2016 | $0 | $45,500 | $5,400 | $40,100 |
| 2015 | -- | $45,500 | $5,400 | $40,100 |
| 2014 | -- | $50,200 | $5,400 | $44,800 |
| 2013 | $2,872 | $48,700 | $5,200 | $43,500 |
Source: Public Records
Map
Nearby Homes