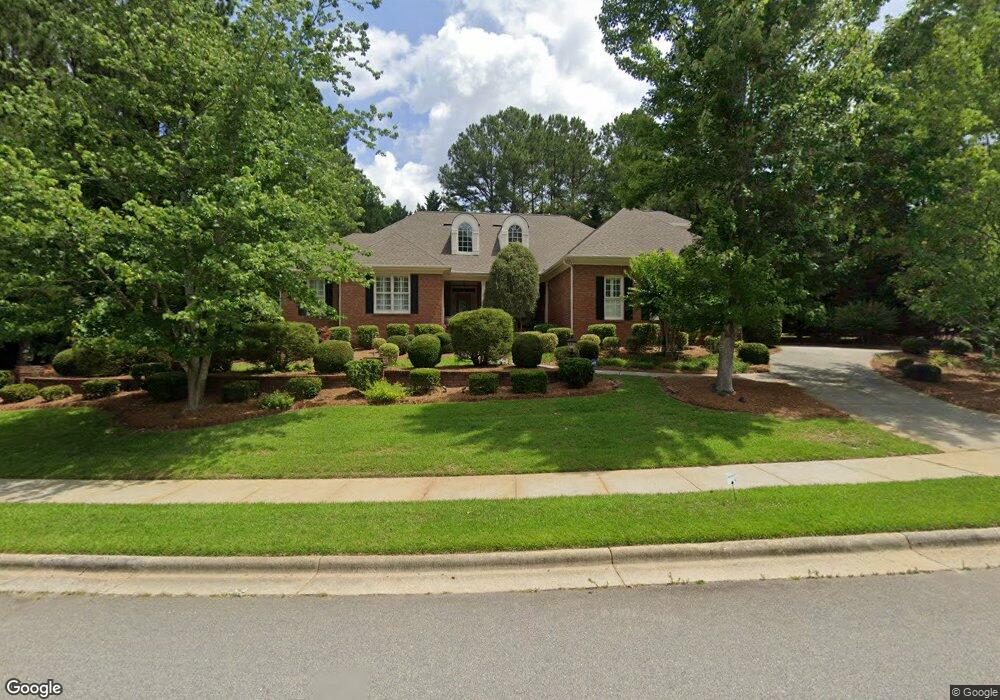
128 Luxorwind Dr Garner, NC 27529
Estimated Value: $564,000 - $762,000
4
Beds
4
Baths
3,337
Sq Ft
$201/Sq Ft
Est. Value
About This Home
This home is located at 128 Luxorwind Dr, Garner, NC 27529 and is currently estimated at $672,165, approximately $201 per square foot. 128 Luxorwind Dr is a home located in Wake County with nearby schools including Timber Drive Elementary, North Garner Middle, and Garner High.
Ownership History
Date
Name
Owned For
Owner Type
Purchase Details
Closed on
Jun 15, 2025
Sold by
Abdel-Khalek Ihab Abdel-Aziz and Rosa Lili
Bought by
Rosa And Ihab Khalek Family Trust
Current Estimated Value
Purchase Details
Closed on
Sep 13, 2019
Sold by
D R Horton Inc
Bought by
Townsend Clarence
Home Financials for this Owner
Home Financials are based on the most recent Mortgage that was taken out on this home.
Original Mortgage
$251,495
Interest Rate
3.6%
Mortgage Type
VA
Purchase Details
Closed on
Sep 1, 2005
Sold by
Stanley Dwight and Stanley Paula
Bought by
Abdel Khalek Ihab and Abdel Khalek Rosa L
Home Financials for this Owner
Home Financials are based on the most recent Mortgage that was taken out on this home.
Original Mortgage
$320,000
Interest Rate
5.37%
Mortgage Type
Fannie Mae Freddie Mac
Purchase Details
Closed on
Oct 7, 2002
Sold by
Andrews Construction Co Inc
Bought by
Stanley Dwight and Stanley Paula
Create a Home Valuation Report for This Property
The Home Valuation Report is an in-depth analysis detailing your home's value as well as a comparison with similar homes in the area
Home Values in the Area
Average Home Value in this Area
Purchase History
| Date | Buyer | Sale Price | Title Company |
|---|---|---|---|
| Rosa And Ihab Khalek Family Trust | -- | None Listed On Document | |
| Rosa And Ihab Khalek Family Trust | -- | None Listed On Document | |
| Townsend Clarence | $251,500 | None Listed On Document | |
| Abdel Khalek Ihab | $457,500 | None Available | |
| Stanley Dwight | $405,000 | -- |
Source: Public Records
Mortgage History
| Date | Status | Borrower | Loan Amount |
|---|---|---|---|
| Previous Owner | Townsend Clarence | $251,495 | |
| Previous Owner | Abdel Khalek Ihab | $320,000 |
Source: Public Records
Tax History
| Year | Tax Paid | Tax Assessment Tax Assessment Total Assessment is a certain percentage of the fair market value that is determined by local assessors to be the total taxable value of land and additions on the property. | Land | Improvement |
|---|---|---|---|---|
| 2025 | $6,405 | $615,647 | $125,000 | $490,647 |
| 2024 | $6,383 | $615,647 | $125,000 | $490,647 |
| 2023 | $6,015 | $466,869 | $85,000 | $381,869 |
| 2022 | $5,490 | $466,869 | $85,000 | $381,869 |
| 2021 | $5,212 | $466,869 | $85,000 | $381,869 |
| 2020 | $5,142 | $466,869 | $85,000 | $381,869 |
| 2019 | $5,221 | $406,068 | $76,000 | $330,068 |
| 2018 | $0 | $406,068 | $76,000 | $330,068 |
| 2017 | $4,680 | $406,068 | $76,000 | $330,068 |
| 2016 | $4,621 | $406,068 | $76,000 | $330,068 |
| 2015 | -- | $473,527 | $94,000 | $379,527 |
| 2014 | $5,256 | $485,675 | $94,000 | $391,675 |
Source: Public Records
Map
Nearby Homes
- 108 Monabreeze Way
- 1611 Misty Meadow Ln
- 1302 Buffaloe Rd
- 204 Tiffany Cir
- 2020 Navan Ln
- 200 Coachman Dr
- 1500 Miriam Ave
- 104 Whithorne Dr
- 116 Grand Springs Ct Unit 204
- 241 Grand Pointe Dr Unit 404
- 220 Grand Pointe Dr
- 1408 Edgebrook Dr
- 728 Haystack View Rd
- 713 Haystack View Rd
- 1417 Rollman Farm Rd
- 576 Rd
- 1405 Rollman Farm Rd
- 536 Wheatland Country Rd
- 100 Bonica Creek Dr
- 720 Haystack View Rd
- 124 Luxorwind Dr
- 125 Monabreeze Way
- 132 Luxorwind Dr
- 121 Monabreeze Way
- 121 Luxorwind Dr
- 125 Luxorwind Dr
- 120 Luxorwind Dr
- LOT 20 Luxorwind Dr
- LOT 19 Luxorwind Dr
- 129 Luxorwind Dr
- 117 Luxorwind Dr
- 133 Luxorwind Dr
- 117 Monabreeze Way
- 137 Luxorwind Dr
- 113 Luxorwind Dr
- 116 Luxorwind Dr
- 124 Monabreeze Way
- 128 Monobreeze Way
- 128 Monabreeze Way
- 120 Monabreeze Way
Your Personal Tour Guide
Ask me questions while you tour the home.