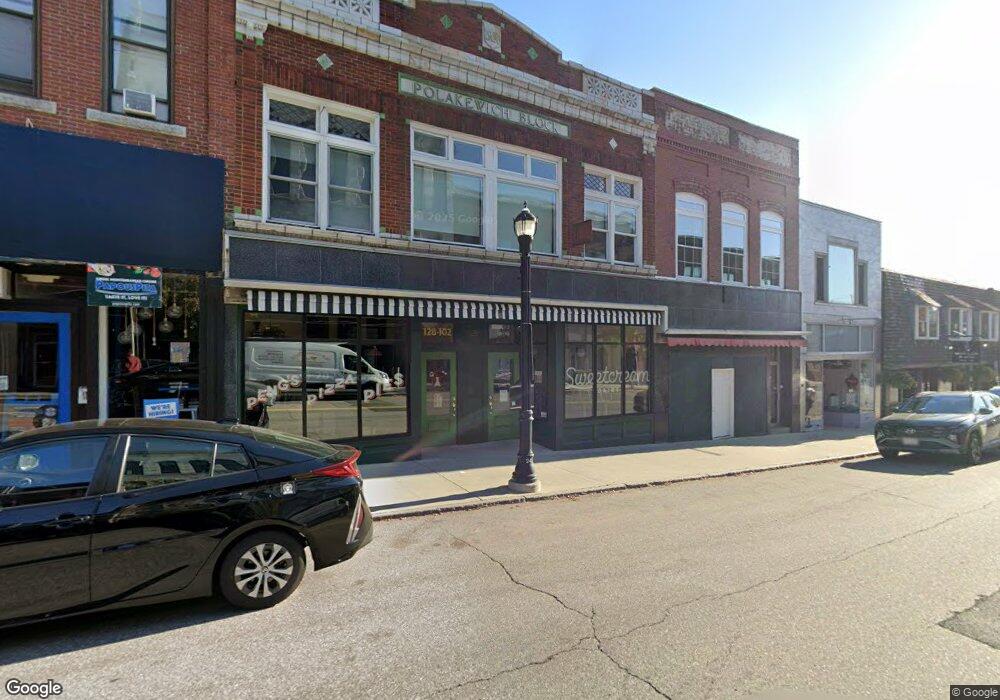
128 Main St Biddeford, ME 04005
Downtown Biddeford NeighborhoodEstimated Value: $634,842
--
Bed
2
Baths
7,852
Sq Ft
$81/Sq Ft
Est. Value
About This Home
This home is located at 128 Main St, Biddeford, ME 04005 and is currently estimated at $634,842, approximately $80 per square foot. 128 Main St is a home located in York County with nearby schools including John F Kennedy Memorial School, Biddeford Primary School, and Biddeford Intermediate School.
Ownership History
Date
Name
Owned For
Owner Type
Purchase Details
Closed on
Dec 19, 2018
Sold by
Tercat North Realty Llc
Bought by
Polakewich Block Llc
Current Estimated Value
Purchase Details
Closed on
Sep 14, 2015
Sold by
Fsb Dev Cjo Inc
Bought by
Tercat North Realty Llc
Create a Home Valuation Report for This Property
The Home Valuation Report is an in-depth analysis detailing your home's value as well as a comparison with similar homes in the area
Home Values in the Area
Average Home Value in this Area
Purchase History
| Date | Buyer | Sale Price | Title Company |
|---|---|---|---|
| Polakewich Block Llc | -- | -- | |
| Polakewich Block Llc | -- | -- | |
| Polakewich Block Llc | -- | -- | |
| Tercat North Realty Llc | -- | -- | |
| Tercat North Realty Llc | -- | -- |
Source: Public Records
Tax History Compared to Growth
Tax History
| Year | Tax Paid | Tax Assessment Tax Assessment Total Assessment is a certain percentage of the fair market value that is determined by local assessors to be the total taxable value of land and additions on the property. | Land | Improvement |
|---|---|---|---|---|
| 2024 | $10,132 | $712,500 | $156,200 | $556,300 |
| 2023 | $9,348 | $712,500 | $156,200 | $556,300 |
| 2022 | $7,939 | $483,800 | $120,100 | $363,700 |
| 2021 | $7,766 | $426,000 | $120,100 | $305,900 |
| 2020 | $7,723 | $385,200 | $120,100 | $265,100 |
| 2019 | $7,696 | $385,200 | $120,100 | $265,100 |
| 2018 | $7,588 | $385,200 | $120,100 | $265,100 |
| 2017 | $7,717 | $384,500 | $120,100 | $264,400 |
| 2016 | $5,078 | $255,700 | $48,000 | $207,700 |
| 2015 | $4,978 | $255,700 | $48,000 | $207,700 |
| 2014 | $4,856 | $255,700 | $48,000 | $207,700 |
| 2013 | -- | $276,700 | $54,700 | $222,000 |
Source: Public Records
Map
Nearby Homes
- 2 Main St Unit 17-506
- 2 Main St Unit 15-310
- 2 Main St Unit 15-403
- 2 Main St Unit 18-420
- 2 Main St Unit 15-311
- 2 Main St Unit 17-508
- 2 Main St Unit 17-414
- 2 Main St Unit 18-307
- 2 Main St Unit 17-415
- 11 King St
- 16 Hill St
- 1 Saco Island Terrace Unit 105
- 1 Saco Island Terrace Unit 337
- 109 Alfred Rd
- 38 South St
- 40 South St
- 84 Pike St
- 4 Kossuth St
- 26 Upper Falls Rd Unit 107
- 26 Upper Falls Rd Unit 108