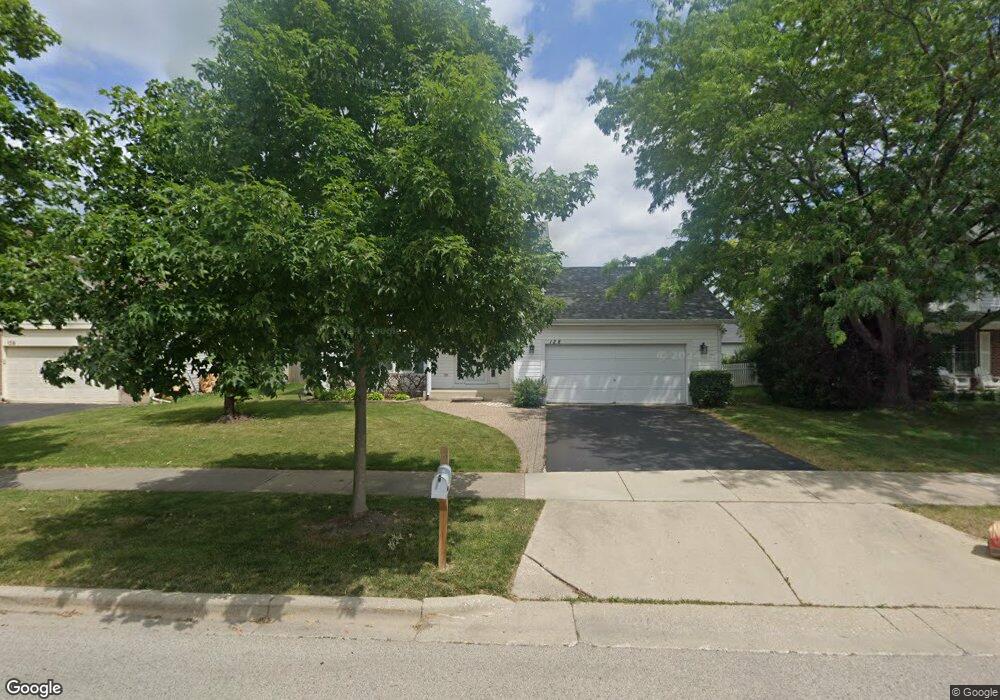
128 Montclair Rd Vernon Hills, IL 60061
Estimated Value: $534,000 - $591,000
3
Beds
3
Baths
1,900
Sq Ft
$294/Sq Ft
Est. Value
About This Home
This home is located at 128 Montclair Rd, Vernon Hills, IL 60061 and is currently estimated at $559,408, approximately $294 per square foot. 128 Montclair Rd is a home located in Lake County with nearby schools including Hawthorn School Of Dual Language, Hawthorn Elementary School South, and Hawthorn Middle School South.
Ownership History
Date
Name
Owned For
Owner Type
Purchase Details
Closed on
Oct 8, 2008
Sold by
Nie Jun and Wei Wei
Bought by
Nie Jun
Current Estimated Value
Home Financials for this Owner
Home Financials are based on the most recent Mortgage that was taken out on this home.
Original Mortgage
$240,000
Outstanding Balance
$158,981
Interest Rate
6.52%
Mortgage Type
Purchase Money Mortgage
Estimated Equity
$400,427
Purchase Details
Closed on
Sep 25, 2008
Sold by
To David and To Matilda
Bought by
Nie Jun and Wei Wei
Home Financials for this Owner
Home Financials are based on the most recent Mortgage that was taken out on this home.
Original Mortgage
$240,000
Outstanding Balance
$158,981
Interest Rate
6.52%
Mortgage Type
Purchase Money Mortgage
Estimated Equity
$400,427
Purchase Details
Closed on
Dec 29, 2005
Sold by
To David and To Matilda
Bought by
To David and To Matilda
Create a Home Valuation Report for This Property
The Home Valuation Report is an in-depth analysis detailing your home's value as well as a comparison with similar homes in the area
Home Values in the Area
Average Home Value in this Area
Purchase History
| Date | Buyer | Sale Price | Title Company |
|---|---|---|---|
| Nie Jun | -- | None Available | |
| Nie Jun | -- | None Available | |
| Nie Jun | $365,000 | City Suburban Title | |
| To David | -- | -- |
Source: Public Records
Mortgage History
| Date | Status | Borrower | Loan Amount |
|---|---|---|---|
| Open | Nie Jun | $240,000 |
Source: Public Records
Tax History Compared to Growth
Tax History
| Year | Tax Paid | Tax Assessment Tax Assessment Total Assessment is a certain percentage of the fair market value that is determined by local assessors to be the total taxable value of land and additions on the property. | Land | Improvement |
|---|---|---|---|---|
| 2024 | $12,621 | $149,345 | $35,943 | $113,402 |
| 2023 | $11,518 | $138,155 | $33,250 | $104,905 |
| 2022 | $11,518 | $129,828 | $31,246 | $98,582 |
| 2021 | $11,147 | $128,428 | $30,909 | $97,519 |
| 2020 | $10,975 | $128,866 | $31,014 | $97,852 |
| 2019 | $10,765 | $128,391 | $30,900 | $97,491 |
| 2018 | $10,880 | $129,891 | $30,538 | $99,353 |
| 2017 | $10,649 | $126,859 | $29,825 | $97,034 |
| 2016 | $10,326 | $121,478 | $28,560 | $92,918 |
| 2015 | $10,178 | $113,605 | $26,709 | $86,896 |
| 2014 | $9,652 | $106,352 | $28,687 | $77,665 |
| 2012 | $9,446 | $106,565 | $28,744 | $77,821 |
Source: Public Records
Map
Nearby Homes
- 5881 Teal Ln
- 5825 Blue Heron Dr
- 5898 Partridge Ln
- 384 Woodland Chase Ln
- 431 Woodland Chase Ln
- 399 Sislow Ln
- 339 Lasalle St
- 5802 Teal Ct
- 306 Lasalle St
- 410 Sislow Ln
- 414 Sislow Ln
- 190 Southgate Dr
- 5801 Port Clinton Rd
- 124 Midway Ln
- 128 Lilly Ct
- 321 Foxford Dr
- 468 Woodland Chase Ln
- 0 Endwood Dr
- 382 Birchwood Ct Unit 82C
- 361 Ashwood Ct Unit 75D
- 118 Montclair Rd
- 138 Montclair Rd
- 127 Sussex Cir
- 106 Montclair Rd
- 117 Sussex Cir
- 137 Sussex Cir
- 123 Montclair Rd
- 107 Sussex Cir
- 135 Montclair Rd
- 94 Montclair Rd
- 113 Montclair Rd
- 160 Montclair Rd
- 95 Sussex Cir
- 101 Montclair Rd
- 161 Sheffield Ln
- 84 Montclair Rd
- 170 Montclair Rd
- 85 Sussex Cir
- 89 Montclair Rd
- 734 Nardis Dr