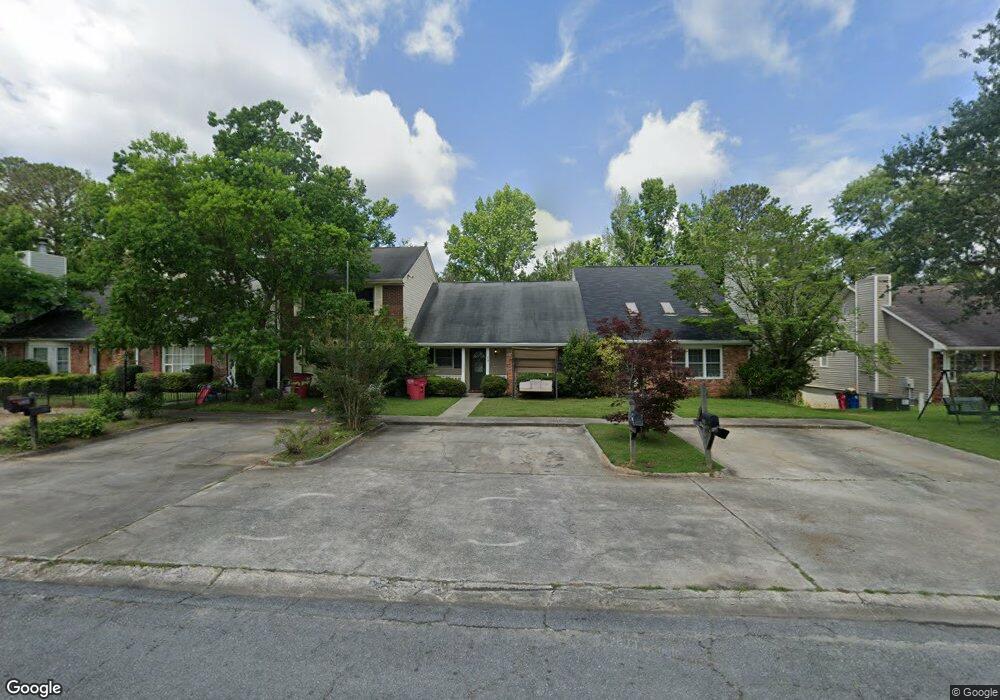
128 N Springs Ct Macon, GA 31210
Estimated Value: $136,000 - $164,000
2
Beds
2
Baths
1,360
Sq Ft
$113/Sq Ft
Est. Value
About This Home
This home is located at 128 N Springs Ct, Macon, GA 31210 and is currently estimated at $154,243, approximately $113 per square foot. 128 N Springs Ct is a home located in Bibb County with nearby schools including Springdale Elementary School, Howard Middle School, and Howard High School.
Ownership History
Date
Name
Owned For
Owner Type
Purchase Details
Closed on
Oct 1, 2009
Sold by
Montgomery Max G
Bought by
Montgomery & Tarpley Properties Inc
Current Estimated Value
Home Financials for this Owner
Home Financials are based on the most recent Mortgage that was taken out on this home.
Original Mortgage
$40,000
Interest Rate
5.15%
Mortgage Type
New Conventional
Purchase Details
Closed on
Sep 14, 2009
Sold by
Wilkes Harold Glen and Wilkes Nina C
Bought by
Montgomery Max G
Home Financials for this Owner
Home Financials are based on the most recent Mortgage that was taken out on this home.
Original Mortgage
$40,000
Interest Rate
5.15%
Mortgage Type
New Conventional
Purchase Details
Closed on
Jun 23, 2005
Sold by
Vance Elaine and Cannon Elaine V
Bought by
Wilkes Nina C
Purchase Details
Closed on
Oct 6, 2004
Create a Home Valuation Report for This Property
The Home Valuation Report is an in-depth analysis detailing your home's value as well as a comparison with similar homes in the area
Home Values in the Area
Average Home Value in this Area
Purchase History
| Date | Buyer | Sale Price | Title Company |
|---|---|---|---|
| Montgomery & Tarpley Properties Inc | -- | None Available | |
| Montgomery Max G | $50,000 | None Available | |
| Wilkes Nina C | $84,500 | None Avilebel | |
| -- | -- | -- |
Source: Public Records
Mortgage History
| Date | Status | Borrower | Loan Amount |
|---|---|---|---|
| Closed | Montgomery Max G | $40,000 |
Source: Public Records
Tax History Compared to Growth
Tax History
| Year | Tax Paid | Tax Assessment Tax Assessment Total Assessment is a certain percentage of the fair market value that is determined by local assessors to be the total taxable value of land and additions on the property. | Land | Improvement |
|---|---|---|---|---|
| 2024 | $1,056 | $41,596 | $5,200 | $36,396 |
| 2023 | $1,035 | $34,936 | $4,000 | $30,936 |
| 2022 | $1,382 | $39,905 | $5,520 | $34,385 |
| 2021 | $1,356 | $35,682 | $5,520 | $30,162 |
| 2020 | $1,385 | $35,682 | $5,520 | $30,162 |
| 2019 | $1,397 | $35,682 | $5,520 | $30,162 |
| 2018 | $2,319 | $35,682 | $5,520 | $30,162 |
| 2017 | $1,337 | $35,682 | $5,520 | $30,162 |
| 2016 | $1,235 | $35,682 | $5,520 | $30,162 |
| 2015 | $1,747 | $35,682 | $5,520 | $30,162 |
| 2014 | $1,750 | $35,682 | $5,520 | $30,162 |
Source: Public Records
Map
Nearby Homes
- 124 N Springs Ct
- 176 N Springs Ct
- 178 Springfield Blvd
- 5369 Rivoli Dr
- 115 Saddle Run Ct
- 123 Saddle Run Ct
- 171 Lake View Dr N
- 181 Rivoli Landing
- 1159 Wesleyan Dr
- 1418 Craddock Way
- 757 Silver Springs Dr
- 920 Wesleyan Dr
- 200 N Wesleyan Cir
- 578 Edgefield Way
- 4964 Kathryn Dr
- 1021 Bass Rd
- 137 Courtney Leigh Ln
- 126 N Springs Ct
- 130 N Springs Ct
- 122 N Springs Ct
- 134 N Springs Ct
- 120 N Springs Ct
- 136 N Springs Ct
- 719 Allison Park
- 118 N Springs Ct
- 138 N Springs Ct
- 138 N Springs Ct Unit 219
- 0 N Springs Ct Unit 7029536
- 0 N Springs Ct Unit 8261724
- 0 N Springs Ct
- 116 N Springs Ct
- N N Springs Ct
- 717 Allison Park
- 713 Allison Park
- 140 N Springs Ct
- 114 N Springs Ct
- 142 N Springs Ct