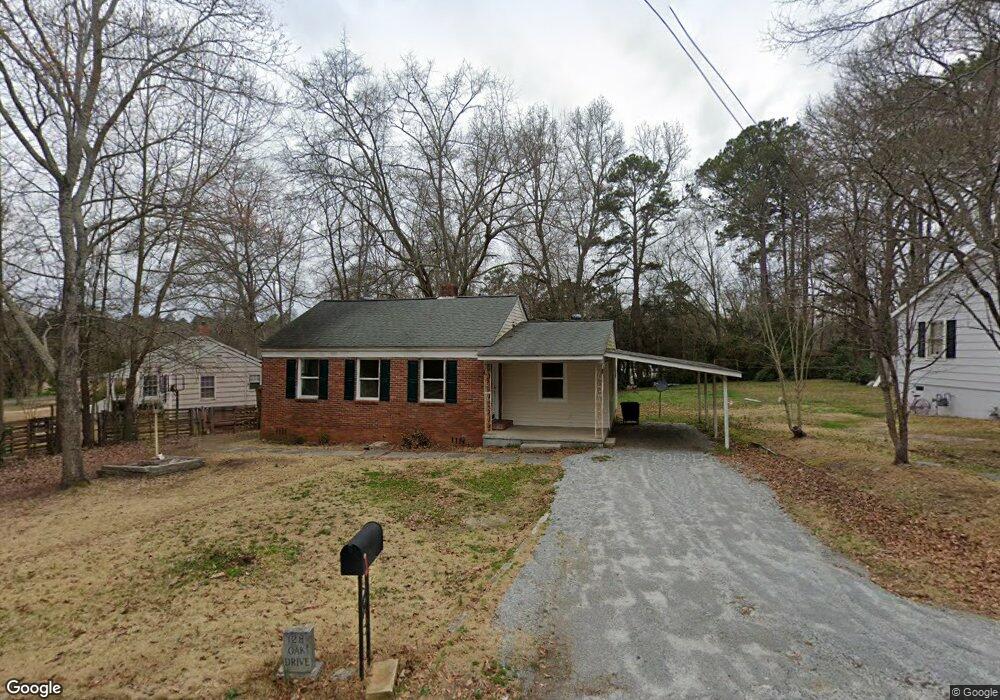
128 Oak Dr Elberton, GA 30635
Estimated Value: $114,000 - $147,000
3
Beds
1
Bath
905
Sq Ft
$150/Sq Ft
Est. Value
About This Home
This home is located at 128 Oak Dr, Elberton, GA 30635 and is currently estimated at $135,892, approximately $150 per square foot. 128 Oak Dr is a home located in Elbert County with nearby schools including Elbert County Primary School, Elbert County Elementary School, and Elbert County Middle School.
Ownership History
Date
Name
Owned For
Owner Type
Purchase Details
Closed on
Jun 18, 2021
Sold by
Ross Ricky L
Bought by
Churchwell Cory Dakota
Current Estimated Value
Home Financials for this Owner
Home Financials are based on the most recent Mortgage that was taken out on this home.
Original Mortgage
$108,007
Outstanding Balance
$97,787
Interest Rate
2.9%
Mortgage Type
FHA
Estimated Equity
$38,105
Purchase Details
Closed on
Feb 23, 2021
Sold by
Imagine Construction Co Inc
Bought by
Ross Ricky and Ross Shannon
Purchase Details
Closed on
Jun 6, 2007
Sold by
Burton Gene and Burton Phyllis S
Bought by
Imagine Construction Company Inc
Purchase Details
Closed on
Aug 17, 2005
Sold by
Wilson Ray D
Bought by
Burton Gene and Burton Phyllis S
Purchase Details
Closed on
Feb 8, 2005
Sold by
Martin Robert F
Bought by
Wilson Ray D and Wilson Debra R
Purchase Details
Closed on
Nov 1, 1958
Sold by
King Development Co
Bought by
Martin Jim Joe and Martin Alice
Create a Home Valuation Report for This Property
The Home Valuation Report is an in-depth analysis detailing your home's value as well as a comparison with similar homes in the area
Home Values in the Area
Average Home Value in this Area
Purchase History
| Date | Buyer | Sale Price | Title Company |
|---|---|---|---|
| Churchwell Cory Dakota | $110,000 | -- | |
| Ross Ricky | $74,000 | -- | |
| Imagine Construction Company Inc | $495,900 | -- | |
| Burton Gene | $25,000 | -- | |
| Wilson Ray D | $20,000 | -- | |
| Martin Jim Joe | $8,200 | -- |
Source: Public Records
Mortgage History
| Date | Status | Borrower | Loan Amount |
|---|---|---|---|
| Open | Churchwell Cory Dakota | $108,007 |
Source: Public Records
Tax History Compared to Growth
Tax History
| Year | Tax Paid | Tax Assessment Tax Assessment Total Assessment is a certain percentage of the fair market value that is determined by local assessors to be the total taxable value of land and additions on the property. | Land | Improvement |
|---|---|---|---|---|
| 2024 | $943 | $38,317 | $3,240 | $35,077 |
| 2023 | $943 | $38,317 | $3,240 | $35,077 |
| 2022 | $693 | $28,178 | $3,240 | $24,938 |
| 2021 | $699 | $28,178 | $3,240 | $24,938 |
| 2020 | $552 | $22,019 | $3,240 | $18,779 |
| 2019 | $570 | $22,019 | $3,240 | $18,779 |
| 2018 | $641 | $22,019 | $3,240 | $18,779 |
| 2017 | $589 | $18,746 | $3,240 | $15,506 |
| 2016 | $550 | $18,746 | $3,240 | $15,506 |
| 2015 | -- | $18,746 | $3,240 | $15,506 |
| 2014 | -- | $18,746 | $3,240 | $15,506 |
| 2013 | -- | $20,539 | $3,240 | $17,299 |
Source: Public Records
Map
Nearby Homes
- 0 Oak Dr Unit 7643600
- 0 Oak Dr Unit 10598083
- 118 Oak Dr
- 108 Brookhaven Cir
- 62 Oak St
- 143 Lake Forest Cir
- 2790 Cedar Creek Rd
- 196 S Oliver St
- 170 Lake Forest Dr
- 136 Forest Ave
- 415 Athenia St
- 270 Dogwood Ln
- 89 College Ave
- 105 S Thomas St
- 0 Rhodes Dr Unit 10455518
- 968 Ext Elbert St
- 245 Edwards St
- 252 Edwards St
- 120 S Tusten St
- 243 W Tate St
- 126 Oak Dr
- 130 Oak Dr
- 0 Oak Dr Unit 7643597
- 0 Oak Dr Unit 10510573
- 0 Oak Dr Unit 8139187
- 0 Oak Dr Unit 7163573
- 132 Oak Dr
- 124 Oak Dr
- 122 Forest Hills Dr
- 122 Forest Hill Rd
- 165 Auld Ave
- 127 Oak Dr
- 124 Forest Hill Rd
- 122 Oak Dr
- 124 Forest Hills Dr
- 126 Forest Hill Rd
- 120 Forest Hill Rd
- 123 Oak Dr
- 120 Forest Hills Dr
- 120 Oak Dr