128 Oak St Springvale, ME 04083
Estimated Value: $349,000 - $374,000
3
Beds
2
Baths
1,106
Sq Ft
$330/Sq Ft
Est. Value
About This Home
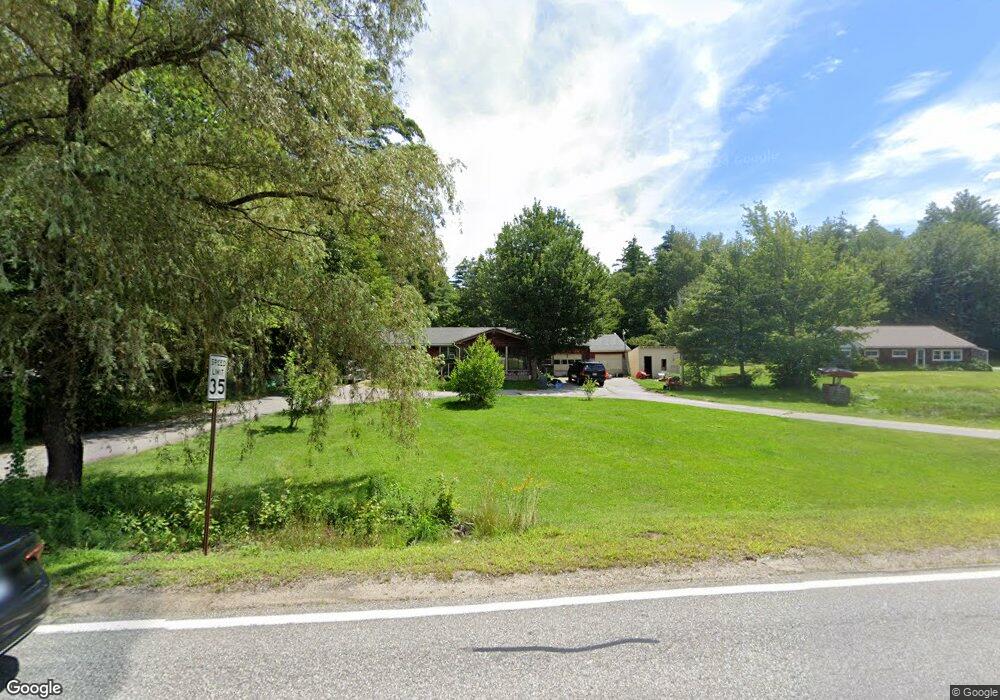
This home is located at 128 Oak St, Springvale, ME 04083 and is currently estimated at $364,738, approximately $329 per square foot. 128 Oak St is a home located in York County with nearby schools including St Thomas Consolidated School and Sanford Christian Academy.
Ownership History
Date
Name
Owned For
Owner Type
Purchase Details
Closed on
May 5, 2011
Sold by
Doyle Jamie A and Saxon Mtg Svcs Inc
Bought by
Saxon Mtg Svcs Inc
Current Estimated Value
Purchase Details
Closed on
Nov 14, 2007
Sold by
Reginald J Landry Lt and Carll Sonja A
Bought by
Doyle Jamie A and Tate Richard J
Home Financials for this Owner
Home Financials are based on the most recent Mortgage that was taken out on this home.
Original Mortgage
$147,250
Interest Rate
6.41%
Mortgage Type
FHA
Create a Home Valuation Report for This Property
The Home Valuation Report is an in-depth analysis detailing your home's value as well as a comparison with similar homes in the area
Home Values in the Area
Average Home Value in this Area
Purchase History
| Date | Buyer | Sale Price | Title Company |
|---|---|---|---|
| Saxon Mtg Svcs Inc | -- | -- | |
| Doyle Jamie A | $155,000 | -- |
Source: Public Records
Mortgage History
| Date | Status | Borrower | Loan Amount |
|---|---|---|---|
| Previous Owner | Doyle Jamie A | $147,250 |
Source: Public Records
Tax History Compared to Growth
Tax History
| Year | Tax Paid | Tax Assessment Tax Assessment Total Assessment is a certain percentage of the fair market value that is determined by local assessors to be the total taxable value of land and additions on the property. | Land | Improvement |
|---|---|---|---|---|
| 2025 | $4,947 | $289,300 | $49,600 | $239,700 |
| 2024 | $4,669 | $289,300 | $49,600 | $239,700 |
| 2023 | $4,342 | $286,800 | $49,600 | $237,200 |
| 2022 | $4,245 | $286,800 | $49,600 | $237,200 |
| 2021 | $4,167 | $229,200 | $49,600 | $179,600 |
| 2020 | $4,068 | $201,800 | $49,600 | $152,200 |
| 2019 | $3,908 | $188,800 | $49,600 | $139,200 |
| 2018 | $3,678 | $179,400 | $44,900 | $134,500 |
| 2017 | $3,501 | $168,800 | $44,900 | $123,900 |
| 2016 | $3,488 | $153,400 | $45,000 | $108,400 |
| 2015 | $3,443 | $156,200 | $49,100 | $107,100 |
| 2014 | $3,546 | $157,900 | $50,800 | $107,100 |
| 2013 | -- | $164,100 | $56,900 | $107,200 |
Source: Public Records
Map
Nearby Homes