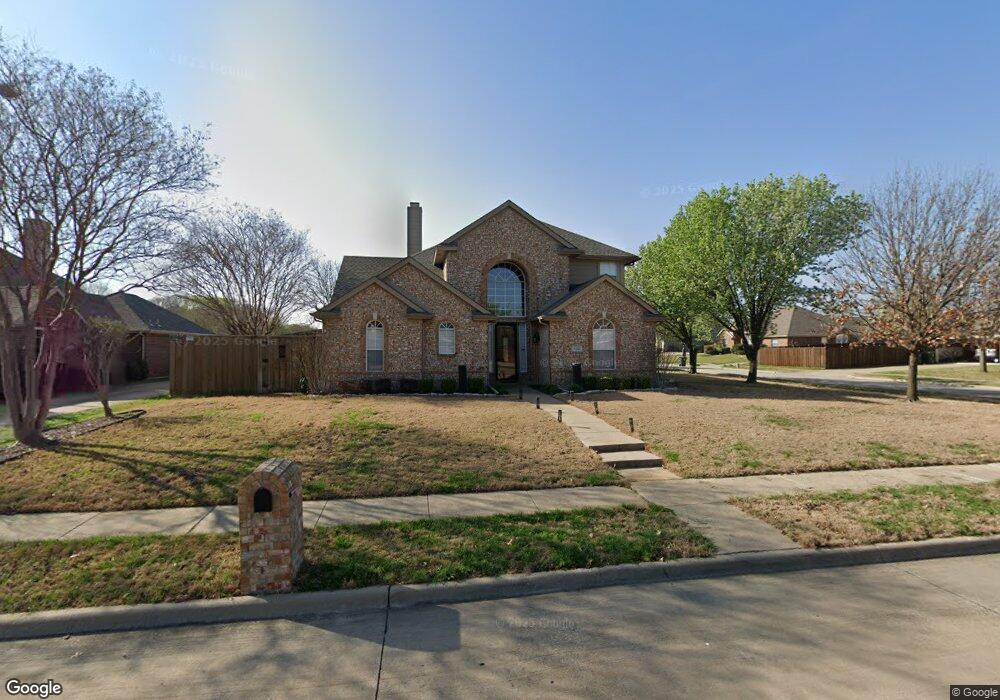
128 Oakbluff Dr Murphy, TX 75094
Estimated Value: $503,105 - $541,000
4
Beds
3
Baths
2,766
Sq Ft
$190/Sq Ft
Est. Value
About This Home
This home is located at 128 Oakbluff Dr, Murphy, TX 75094 and is currently estimated at $526,526, approximately $190 per square foot. 128 Oakbluff Dr is a home located in Collin County with nearby schools including Miller Elementary School, Murphy Middle School, and C A Mcmillen High School.
Ownership History
Date
Name
Owned For
Owner Type
Purchase Details
Closed on
Apr 5, 2020
Sold by
Walter Tab and Walter Sara A
Bought by
Dao Huy Quoc and Nguyen Duyentho L
Current Estimated Value
Home Financials for this Owner
Home Financials are based on the most recent Mortgage that was taken out on this home.
Original Mortgage
$200,000
Outstanding Balance
$177,176
Interest Rate
3.4%
Mortgage Type
New Conventional
Estimated Equity
$349,350
Purchase Details
Closed on
Jul 20, 2011
Sold by
Jones Mark K and Jones Pam
Bought by
Walter Tab
Home Financials for this Owner
Home Financials are based on the most recent Mortgage that was taken out on this home.
Original Mortgage
$155,000
Interest Rate
4.52%
Mortgage Type
New Conventional
Purchase Details
Closed on
Aug 6, 2001
Sold by
U S Home Corp
Bought by
Jones Mark K and Jones Pam
Home Financials for this Owner
Home Financials are based on the most recent Mortgage that was taken out on this home.
Original Mortgage
$202,980
Interest Rate
7.14%
Mortgage Type
VA
Create a Home Valuation Report for This Property
The Home Valuation Report is an in-depth analysis detailing your home's value as well as a comparison with similar homes in the area
Home Values in the Area
Average Home Value in this Area
Purchase History
| Date | Buyer | Sale Price | Title Company |
|---|---|---|---|
| Dao Huy Quoc | -- | None Available | |
| Walter Tab | -- | Natgf | |
| Jones Mark K | -- | -- |
Source: Public Records
Mortgage History
| Date | Status | Borrower | Loan Amount |
|---|---|---|---|
| Open | Dao Huy Quoc | $200,000 | |
| Previous Owner | Walter Tab | $155,000 | |
| Previous Owner | Jones Mark K | $202,980 |
Source: Public Records
Tax History
| Year | Tax Paid | Tax Assessment Tax Assessment Total Assessment is a certain percentage of the fair market value that is determined by local assessors to be the total taxable value of land and additions on the property. | Land | Improvement |
|---|---|---|---|---|
| 2025 | $6,574 | $520,842 | $120,750 | $410,436 |
| 2024 | $6,574 | $473,493 | $120,750 | $417,800 |
| 2023 | $6,574 | $430,448 | $120,750 | $364,067 |
| 2022 | $7,664 | $391,316 | $105,000 | $345,320 |
| 2021 | $7,346 | $355,742 | $84,000 | $271,742 |
| 2020 | $6,698 | $320,698 | $73,500 | $247,198 |
| 2019 | $7,228 | $329,910 | $73,500 | $256,410 |
| 2018 | $7,133 | $322,592 | $73,500 | $254,330 |
| 2017 | $6,484 | $293,265 | $73,500 | $219,765 |
| 2016 | $5,977 | $287,937 | $63,000 | $224,937 |
| 2015 | $4,865 | $251,352 | $47,250 | $204,102 |
Source: Public Records
Map
Nearby Homes
- 524 Jasmine Dr
- 5811 Abingdon Dr
- 316 Mimosa Dr
- 428 Rainforest Ct
- 202 Sweetgum Dr
- 155 Sunset Dr
- 3207 Abingdon Dr
- 1008 Yarnell Place
- 300 Shady Timbers Ln
- 465 Kinney Dr
- 308 Rolling Oak Dr
- 412 Skyline Dr
- 505 Horizon Ct
- 5924 Mulvane Dr
- 101 Hawthorne Dr
- 3104 Stonehenge Dr
- 402 S Maxwell Creek Rd
- 110 Birch Blvd
- 3041 Hillingdon Dr
- 600 E Fm 544
- 132 Oakbluff Dr
- 530 Hackberry Dr
- 122 Oakbluff Dr
- 136 Oakbluff Dr
- 129 Oakbluff Dr
- 125 Oakbluff Dr
- 529 Hackberry Dr
- 133 Oakbluff Dr
- 121 Oakbluff Dr
- 534 Hackberry Dr
- 116 Oakbluff Dr
- 140 Oakbluff Dr
- 137 Oakbluff Dr
- 117 Oakbluff Dr
- 533 Hackberry Dr
- 127 Westwood Dr
- 131 Westwood Dr
- 141 Oakbluff Dr
- 144 Oakbluff Dr
- 530 Tall Tree Dr
Your Personal Tour Guide
Ask me questions while you tour the home.