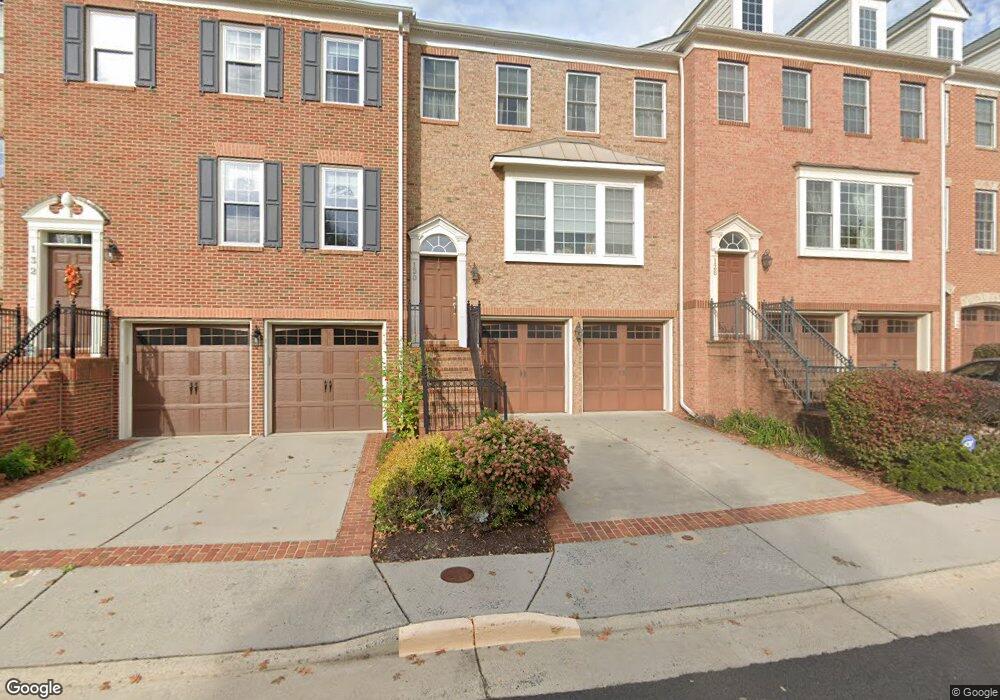
128 Quietwalk Ln Herndon, VA 20170
Estimated Value: $767,000 - $840,000
3
Beds
4
Baths
2,634
Sq Ft
$304/Sq Ft
Est. Value
About This Home
This home is located at 128 Quietwalk Ln, Herndon, VA 20170 and is currently estimated at $800,116, approximately $303 per square foot. 128 Quietwalk Ln is a home located in Fairfax County with nearby schools including Herndon Elementary, Herndon Middle School, and Herndon High School.
Ownership History
Date
Name
Owned For
Owner Type
Purchase Details
Closed on
May 23, 2015
Sold by
Travis Jeanne A
Bought by
Travis Scott F
Current Estimated Value
Home Financials for this Owner
Home Financials are based on the most recent Mortgage that was taken out on this home.
Original Mortgage
$510,000
Outstanding Balance
$386,663
Interest Rate
3.25%
Mortgage Type
VA
Estimated Equity
$413,453
Purchase Details
Closed on
May 13, 2010
Sold by
Pezeshki Jonah M and Zhang Jing
Bought by
Travis Scott F
Home Financials for this Owner
Home Financials are based on the most recent Mortgage that was taken out on this home.
Original Mortgage
$495,000
Interest Rate
5.11%
Mortgage Type
VA
Purchase Details
Closed on
Oct 18, 2006
Sold by
Neighborhoods Spring Park
Bought by
Pezeshki Jonah M and Zhang,Jing
Home Financials for this Owner
Home Financials are based on the most recent Mortgage that was taken out on this home.
Original Mortgage
$467,050
Interest Rate
6.49%
Mortgage Type
New Conventional
Create a Home Valuation Report for This Property
The Home Valuation Report is an in-depth analysis detailing your home's value as well as a comparison with similar homes in the area
Home Values in the Area
Average Home Value in this Area
Purchase History
| Date | Buyer | Sale Price | Title Company |
|---|---|---|---|
| Travis Scott F | -- | -- | |
| Travis Scott F | $495,000 | -- | |
| Pezeshki Jonah M | $583,833 | -- |
Source: Public Records
Mortgage History
| Date | Status | Borrower | Loan Amount |
|---|---|---|---|
| Open | Travis Scott F | $510,000 | |
| Previous Owner | Travis Scott F | $495,000 | |
| Previous Owner | Pezeshki Jonah M | $467,050 |
Source: Public Records
Tax History Compared to Growth
Tax History
| Year | Tax Paid | Tax Assessment Tax Assessment Total Assessment is a certain percentage of the fair market value that is determined by local assessors to be the total taxable value of land and additions on the property. | Land | Improvement |
|---|---|---|---|---|
| 2025 | $9,447 | $705,440 | $220,000 | $485,440 |
| 2024 | $9,447 | $665,950 | $220,000 | $445,950 |
| 2023 | $8,932 | $643,280 | $220,000 | $423,280 |
| 2022 | $8,616 | $611,730 | $200,000 | $411,730 |
| 2021 | $6,532 | $556,650 | $180,000 | $376,650 |
| 2020 | $6,511 | $550,150 | $180,000 | $370,150 |
| 2019 | $6,302 | $532,520 | $180,000 | $352,520 |
| 2018 | $5,931 | $515,730 | $180,000 | $335,730 |
| 2017 | $6,109 | $526,190 | $180,000 | $346,190 |
| 2016 | $6,139 | $529,950 | $180,000 | $349,950 |
| 2015 | $5,853 | $524,420 | $180,000 | $344,420 |
| 2014 | -- | $524,420 | $180,000 | $344,420 |
Source: Public Records
Map
Nearby Homes
- 310 Missouri Ave
- 656 Stuart Ct
- 711 Herndon Woods Ct
- 507 Dakota Dr
- 415 Virginia Ave
- 12228 Dorrance Ct
- 12185 Abington Hall Place Unit 104
- 12901 Alton Square Unit 102
- 565 Florida Ave Unit 201
- 563 Florida Ave Unit 102
- 719 Palmer Dr
- 12165 Abington Hall Place Unit 302
- 418 Florida Ave
- 108 Monroe Mills Ln
- 717 Campbell Way
- 702 Elden St Unit B
- 12913 Alton Square Unit 219
- 12913 Alton Square Unit 210
- 545 Florida Ave Unit 102
- 2204 Westcourt Ln Unit 109
- 126 Quietwalk Ln
- 130 Quietwalk Ln
- 132 Quietwalk Ln
- 124 Quietwalk Ln
- 134 Quietwalk Ln
- 136 Quietwalk Ln
- 118 Quietwalk Ln
- 116 Quietwalk Ln
- 120 Quietwalk Ln
- 122 Quietwalk Ln
- 426 Old Dominion Ave
- 114 Quietwalk Ln
- 112 Quietwalk Ln
- 424 Old Dominion Ave
- 110 Quietwalk Ln
- 108 Quietwalk Ln
- 106 Quietwalk Ln
- 422 Old Dominion Ave
- 104 Quietwalk Ln
- 415 Spring St