Estimated Value: $273,000 - $399,000
3
Beds
3
Baths
1,876
Sq Ft
$180/Sq Ft
Est. Value
About This Home
This home is located at 128 Reynolds Bend Dr SE, Rome, GA 30161 and is currently estimated at $338,512, approximately $180 per square foot. 128 Reynolds Bend Dr SE is a home located in Floyd County with nearby schools including Model Middle School and Model High School.
Ownership History
Date
Name
Owned For
Owner Type
Purchase Details
Closed on
Jul 12, 2021
Sold by
Perry David
Bought by
Perry Joel
Current Estimated Value
Home Financials for this Owner
Home Financials are based on the most recent Mortgage that was taken out on this home.
Original Mortgage
$111,805
Outstanding Balance
$93,627
Interest Rate
2.96%
Mortgage Type
New Conventional
Estimated Equity
$244,885
Purchase Details
Closed on
Aug 7, 2014
Sold by
P and R
Bought by
P and R
Purchase Details
Closed on
Oct 23, 2013
Sold by
Metcalf Keli
Bought by
Perry David
Purchase Details
Closed on
Jan 26, 2012
Bought by
Metcalf Keli
Purchase Details
Closed on
Aug 2, 2011
Sold by
Wells Fargo Bank
Bought by
Federal Home Loan
Purchase Details
Closed on
Sep 25, 2002
Sold by
Lewis Amanda Leigh
Bought by
Cavin David and Amanda Cavin
Purchase Details
Closed on
Jun 8, 1993
Sold by
Lewis Leatha L
Bought by
Lewis Amanda Leigh
Purchase Details
Closed on
Jun 14, 1991
Bought by
P and R
Create a Home Valuation Report for This Property
The Home Valuation Report is an in-depth analysis detailing your home's value as well as a comparison with similar homes in the area
Home Values in the Area
Average Home Value in this Area
Purchase History
| Date | Buyer | Sale Price | Title Company |
|---|---|---|---|
| Perry Joel | $111,804 | -- | |
| P | -- | -- | |
| Perry David | $100,000 | -- | |
| Metcalf Keli | -- | -- | |
| Federal Home Loan | $120,403 | -- | |
| Wells Fargo Bank | $120,403 | -- | |
| Cavin David | -- | -- | |
| Lewis Amanda Leigh | -- | -- | |
| P | -- | -- | |
| P | -- | -- | |
| P | -- | -- | |
| P | -- | -- | |
| P | -- | -- | |
| P | -- | -- | |
| P | -- | -- | |
| P | -- | -- | |
| P | -- | -- | |
| Lewis Leatha L | $21,000 | -- | |
| P | -- | -- |
Source: Public Records
Mortgage History
| Date | Status | Borrower | Loan Amount |
|---|---|---|---|
| Open | Perry Joel | $111,805 |
Source: Public Records
Tax History Compared to Growth
Tax History
| Year | Tax Paid | Tax Assessment Tax Assessment Total Assessment is a certain percentage of the fair market value that is determined by local assessors to be the total taxable value of land and additions on the property. | Land | Improvement |
|---|---|---|---|---|
| 2024 | $4,173 | $134,800 | $20,244 | $114,556 |
| 2023 | $3,283 | $114,504 | $18,404 | $96,100 |
| 2022 | $2,790 | $94,030 | $15,301 | $78,729 |
| 2021 | $1,716 | $56,838 | $13,867 | $42,971 |
| 2020 | $1,493 | $49,059 | $12,059 | $37,000 |
| 2019 | $1,422 | $47,338 | $12,059 | $35,279 |
| 2018 | $1,352 | $44,946 | $11,487 | $33,459 |
| 2017 | $1,302 | $43,191 | $10,636 | $32,555 |
| 2016 | $1,303 | $42,688 | $10,600 | $32,088 |
| 2015 | $1,181 | $42,688 | $10,600 | $32,088 |
| 2014 | $1,181 | $42,688 | $10,600 | $32,088 |
Source: Public Records
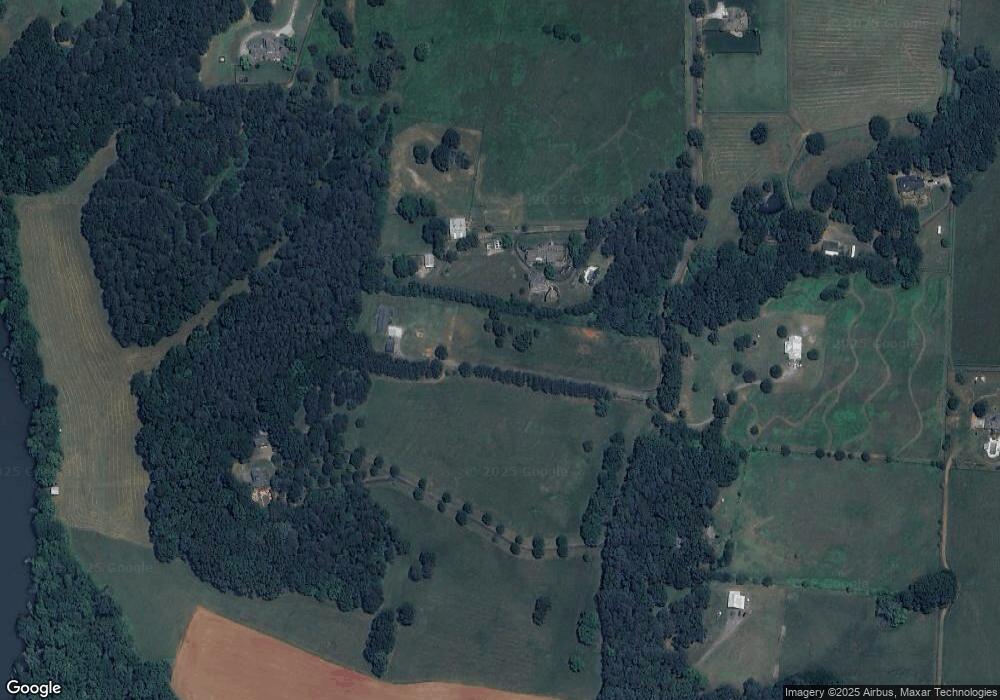
Map
Nearby Homes
- 139 Shoals Ferry Rd SE
- 7 Trimble Way SE
- 0 Mountain Creek Dr SE Unit 10436191
- 30 Mountain Creek Dr SE
- 127 Branson Rd SE
- 158 Sproull Rd SE
- 12 Winterberry Ln SE
- 1 Outpost Trail SE
- 3 Outpost Trail SE
- 16 Fallen Branch Cir SE
- 0 Fallen Branch Cir SE Unit 7397536
- 0 Fallen Branch Cir SE Unit 10311756
- 0 Fallen Branch Cir SE Unit 7234792
- 0 Fallen Branch Cir SE Unit 10172755
- 21 Everwood Ct SE
- 11 Parkwood Dr NE
- 0 N Quarters Dr Unit 7467468
- 0 N Quarters Dr Unit 37 10390869
- 1849 Morrison Camp Ground Rd NE
- 550 Freeman Ferry Rd SE
- 128 Reynolds Bend Dr SE
- 86 Reynolds Bend Dr SE
- 86 Reynolds Bend Rd SE
- 200 Reynolds Bend Dr SE
- 15 Shoals Ferry Rd SE
- 199 Reynolds Bend Dr SE
- 9 Shoals Ferry Rd
- 33 Reynolds Bend Rd SE
- 39 Shoals Ferry Rd SE
- 51 Shoals Ferry Rd SE
- 0 Reynolds Bend Dr SE Unit 7438682
- 0 Reynolds Bend Dr SE Unit 7002434
- 0 Reynolds Bend Dr SE Unit 7002452
- 0 Reynolds Bend Dr SE Unit 7505692
- 0 Reynolds Bend Dr SE Unit 3133999
- 0 Reynolds Bend Dr SE Unit 7490437
- 765 Reynolds Bend Rd SE
- 26 Shoals Ferry Rd SE Unit TRACT 6
- 26 Shoals Ferry Rd SE
- 79 Shoals Ferry Rd SE