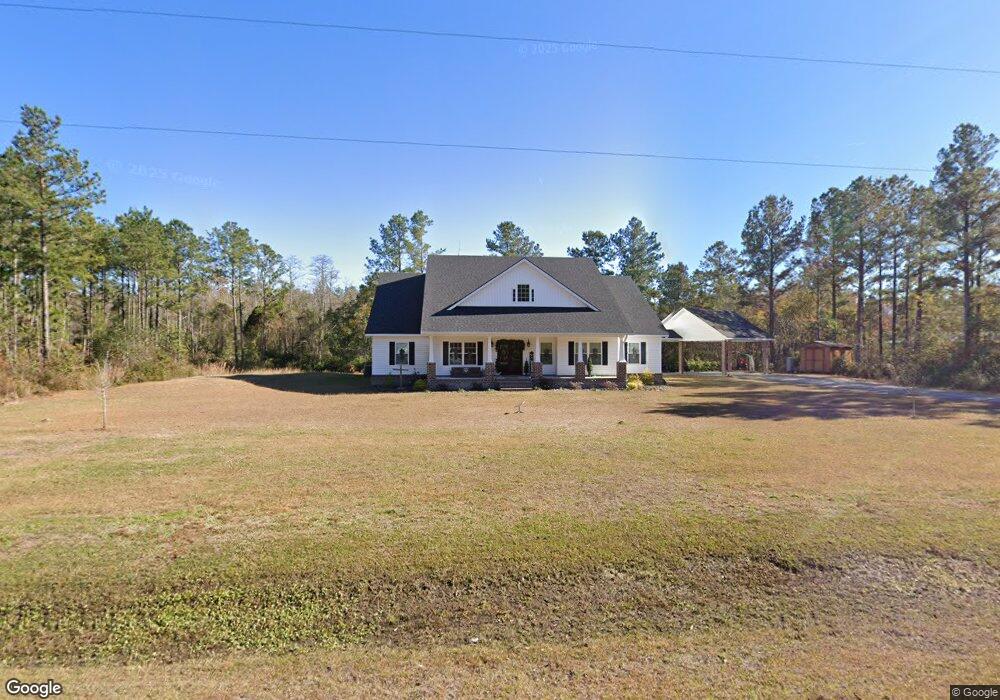
128 Runs Crossing Dr Springfield, GA 31329
Estimated Value: $596,000 - $677,558
Studio
--
Bath
3,770
Sq Ft
$171/Sq Ft
Est. Value
About This Home
This home is located at 128 Runs Crossing Dr, Springfield, GA 31329 and is currently estimated at $642,890, approximately $170 per square foot. 128 Runs Crossing Dr is a home located in Effingham County with nearby schools including Ebenezer Elementary School, Ebenezer Middle School, and Effingham County High School.
Ownership History
Date
Name
Owned For
Owner Type
Purchase Details
Closed on
Oct 9, 2018
Sold by
Merritt Justin Boyd
Bought by
Merritt Justin Boyd and Merritt Kathryn Leslie H
Current Estimated Value
Home Financials for this Owner
Home Financials are based on the most recent Mortgage that was taken out on this home.
Original Mortgage
$328,100
Interest Rate
4.6%
Mortgage Type
Commercial
Purchase Details
Closed on
Dec 11, 2017
Sold by
Smith Robert S
Bought by
Merritt Justin Boyd and Merritt Leslie Higgs
Home Financials for this Owner
Home Financials are based on the most recent Mortgage that was taken out on this home.
Original Mortgage
$35,550
Interest Rate
3.9%
Mortgage Type
New Conventional
Purchase Details
Closed on
Aug 30, 2011
Sold by
Rsw Investors Llc
Bought by
Smith Robert S and Smith Peggy Z
Purchase Details
Closed on
Jun 7, 2004
Bought by
Rsw Investors Llc
Create a Home Valuation Report for This Property
The Home Valuation Report is an in-depth analysis detailing your home's value as well as a comparison with similar homes in the area
Home Values in the Area
Average Home Value in this Area
Purchase History
| Date | Buyer | Sale Price | Title Company |
|---|---|---|---|
| Merritt Justin Boyd | -- | -- | |
| Merritt Justin Boyd | $39,500 | -- | |
| Smith Robert S | $197,038 | -- | |
| Rsw Investors Llc | -- | -- |
Source: Public Records
Mortgage History
| Date | Status | Borrower | Loan Amount |
|---|---|---|---|
| Closed | Merritt Justin Boyd | $328,100 | |
| Previous Owner | Merritt Justin Boyd | $35,550 |
Source: Public Records
Tax History
| Year | Tax Paid | Tax Assessment Tax Assessment Total Assessment is a certain percentage of the fair market value that is determined by local assessors to be the total taxable value of land and additions on the property. | Land | Improvement |
|---|---|---|---|---|
| 2025 | $5,955 | $250,735 | $69,432 | $181,303 |
| 2024 | $5,955 | $215,049 | $46,288 | $168,761 |
| 2023 | $4,438 | $202,980 | $31,560 | $171,420 |
| 2022 | $5,014 | $181,538 | $25,353 | $156,185 |
| 2021 | $4,909 | $160,736 | $18,305 | $142,431 |
| 2020 | $4,609 | $148,684 | $18,305 | $130,379 |
| 2019 | $532 | $18,305 | $18,305 | $0 |
| 2018 | $544 | $18,305 | $18,305 | $0 |
| 2017 | $551 | $18,305 | $18,305 | $0 |
| 2016 | $524 | $18,305 | $18,305 | $0 |
| 2015 | -- | $16,150 | $16,150 | $0 |
| 2014 | -- | $16,150 | $16,150 | $0 |
| 2013 | -- | $16,149 | $16,149 | $0 |
Source: Public Records
Map
Nearby Homes
- 2429 Ga Highway 119 N
- 0 (Tract #1) Indigo Rd
- 873 Mock Rd
- 107 Teal Dr
- 132 Teal Dr
- 300 Kieffer Hill Rd
- 179 Hawk Hammock Dr
- 0 Stillwell Clyo Rd Unit SA340237
- 103 Mingledorff Way
- 1441 Old Dixie Hwy S
- 124 Jennie Dr
- 0 Springfield Egypt Rd Unit SA343058
- 904 N Ash St
- 301 S Ash St
- 900 Laurel N
- 0 Georgia 119 Unit 317227
- 0 W Madison St
- 560 Log Landing Rd
- 101 Black Pine Dr
- 216 Deer Rd
- 130 Runs Crossing Dr
- 126 Runs Crossing Dr
- 137 Runs Crossing Dr
- 124 Runs Crossing Dr
- 132 Runs Crossing Dr
- 175 Roberts Rd
- 101 Runs Crossing Dr
- 122 Runs Crossing Dr
- 2640 Ga Highway 119 N
- 2710 Ga Highway 119 N
- 2646 Ga Highway 119 N
- 2646 Georgia 119
- 2700 Highway 119
- 2700 Ga Highway 119 N Unit 3
- 2700 Ga Highway 119 N
- 2700 Georgia 119 Unit 3
- 2700 Georgia 119
- 120 Runs Crossing Dr
- 120 Runs Crossing Dr Unit 11
- 339 Indigo Rd
Your Personal Tour Guide
Ask me questions while you tour the home.