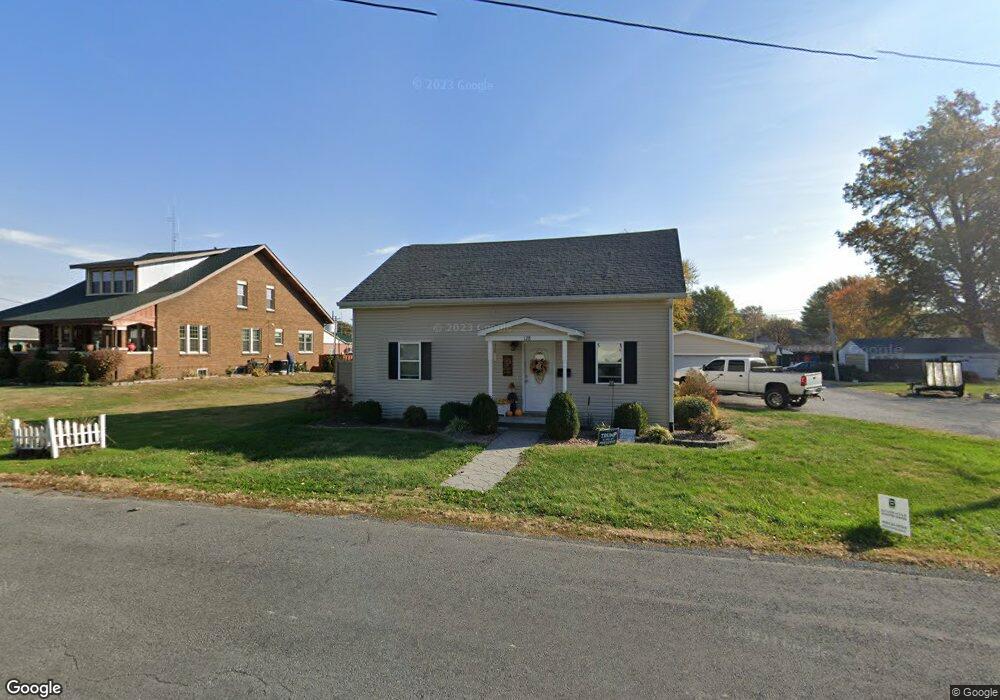
128 S Cherry St Breese, IL 62230
Estimated Value: $131,000 - $194,000
3
Beds
1
Bath
1,268
Sq Ft
$139/Sq Ft
Est. Value
About This Home
This home is located at 128 S Cherry St, Breese, IL 62230 and is currently estimated at $176,091, approximately $138 per square foot. 128 S Cherry St is a home located in Clinton County with nearby schools including Breese ESD #12, Beckemeyer Elementary School, and Central Community High School.
Ownership History
Date
Name
Owned For
Owner Type
Purchase Details
Closed on
Oct 8, 2015
Sold by
Richter Raymond
Bought by
Berning Rhonda
Current Estimated Value
Purchase Details
Closed on
Sep 21, 2012
Sold by
Voss Gertrude and Voss Anthony F
Bought by
Richer Raymond
Home Financials for this Owner
Home Financials are based on the most recent Mortgage that was taken out on this home.
Original Mortgage
$70,000
Interest Rate
2.75%
Mortgage Type
Future Advance Clause Open End Mortgage
Create a Home Valuation Report for This Property
The Home Valuation Report is an in-depth analysis detailing your home's value as well as a comparison with similar homes in the area
Home Values in the Area
Average Home Value in this Area
Purchase History
| Date | Buyer | Sale Price | Title Company |
|---|---|---|---|
| Berning Rhonda | $114,000 | None Available | |
| Richer Raymond | $27,500 | None Available |
Source: Public Records
Mortgage History
| Date | Status | Borrower | Loan Amount |
|---|---|---|---|
| Previous Owner | Richer Raymond | $70,000 |
Source: Public Records
Tax History
| Year | Tax Paid | Tax Assessment Tax Assessment Total Assessment is a certain percentage of the fair market value that is determined by local assessors to be the total taxable value of land and additions on the property. | Land | Improvement |
|---|---|---|---|---|
| 2024 | $2,789 | $46,420 | $5,940 | $40,480 |
| 2023 | $2,789 | $43,790 | $5,600 | $38,190 |
| 2022 | $2,750 | $39,810 | $5,090 | $34,720 |
| 2021 | $2,445 | $37,920 | $4,850 | $33,070 |
| 2020 | $2,386 | $36,460 | $4,660 | $31,800 |
| 2019 | $2,338 | $36,460 | $4,660 | $31,800 |
| 2018 | $2,328 | $34,632 | $4,566 | $30,066 |
| 2017 | $2,258 | $33,300 | $4,390 | $28,910 |
| 2016 | $2,236 | $33,300 | $4,390 | $28,910 |
| 2015 | $963 | $17,410 | $4,390 | $13,020 |
| 2013 | $963 | $9,110 | $4,390 | $4,720 |
Source: Public Records
Map
Nearby Homes
- 534 S 2nd St
- 265 N 1st St
- 889 N 1st St
- 210 N Elm St
- 654 S 7th St
- 1031 N 1st St
- 655 N 8th St
- 320 N Oak St
- 1059 N Cherry St
- 1251 Sunset Dr
- 129 Jefferson Dr
- 13964 Best One Dr
- 10520 Vonder Haar Ln
- 9953 President Ct
- 10675 Buckingham Ct
- 8011 von Bokel Dr
- 15 Rosewood Ln
- 51 W Logan St
- 887 W 3rd St
- 4650 Wyatt Way
Your Personal Tour Guide
Ask me questions while you tour the home.