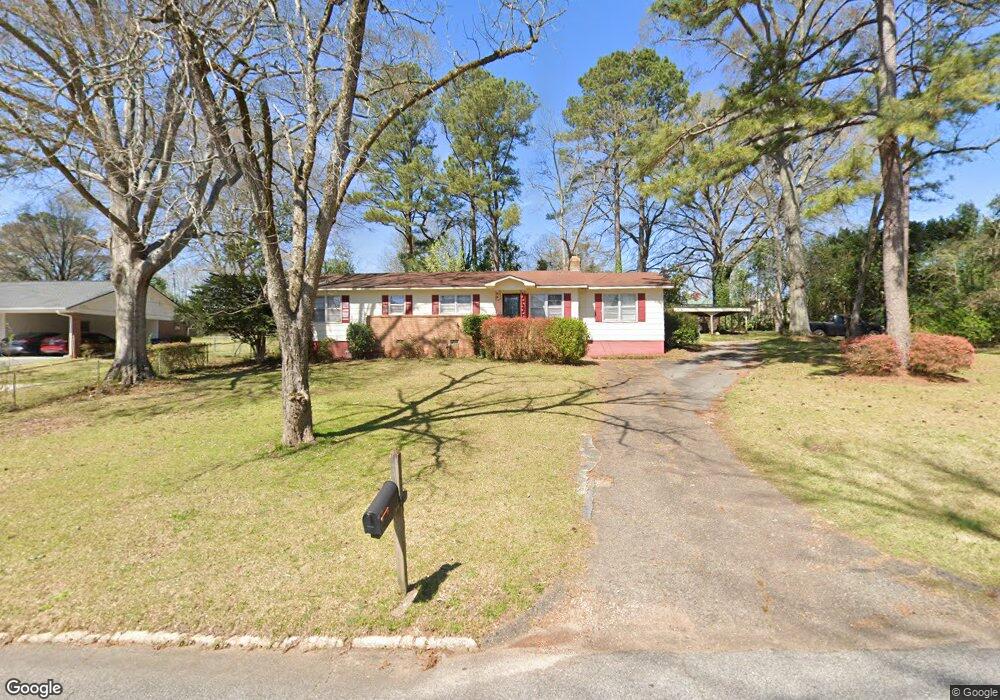
128 S Chilton Crescent Lagrange, GA 30240
Estimated Value: $166,000 - $231,000
3
Beds
2
Baths
1,652
Sq Ft
$125/Sq Ft
Est. Value
About This Home
This home is located at 128 S Chilton Crescent, Lagrange, GA 30240 and is currently estimated at $205,884, approximately $124 per square foot. 128 S Chilton Crescent is a home located in Troup County with nearby schools including Franklin Forest Elementary School, Hollis Hand Elementary School, and Ethel W. Kight Elementary School.
Ownership History
Date
Name
Owned For
Owner Type
Purchase Details
Closed on
Jan 31, 2008
Sold by
Ritchie Gayla Jean
Bought by
Ferguson Ronald A
Current Estimated Value
Home Financials for this Owner
Home Financials are based on the most recent Mortgage that was taken out on this home.
Original Mortgage
$77,000
Outstanding Balance
$47,908
Interest Rate
6.06%
Mortgage Type
New Conventional
Estimated Equity
$157,976
Purchase Details
Closed on
Jan 30, 1964
Sold by
Jenkins Donald R
Bought by
Ferguson Alton J
Create a Home Valuation Report for This Property
The Home Valuation Report is an in-depth analysis detailing your home's value as well as a comparison with similar homes in the area
Purchase History
| Date | Buyer | Sale Price | Title Company |
|---|---|---|---|
| Ferguson Ronald A | -- | -- | |
| Ferguson Ronald A | -- | -- | |
| Ferguson Ronald A | $60,000 | -- | |
| Ferguson Alton J | -- | -- |
Source: Public Records
Mortgage History
| Date | Status | Borrower | Loan Amount |
|---|---|---|---|
| Open | Ferguson Ronald A | $77,000 | |
| Closed | Ferguson Ronald A | $77,000 |
Source: Public Records
Tax History
| Year | Tax Paid | Tax Assessment Tax Assessment Total Assessment is a certain percentage of the fair market value that is determined by local assessors to be the total taxable value of land and additions on the property. | Land | Improvement |
|---|---|---|---|---|
| 2025 | $1,993 | $73,080 | $8,600 | $64,480 |
| 2024 | $1,724 | $63,204 | $8,600 | $54,604 |
| 2023 | $1,298 | $47,596 | $8,600 | $38,996 |
| 2022 | $1,226 | $43,916 | $8,600 | $35,316 |
| 2021 | $1,071 | $35,520 | $8,600 | $26,920 |
| 2020 | $1,071 | $35,520 | $8,600 | $26,920 |
| 2019 | $1,000 | $33,160 | $8,600 | $24,560 |
| 2018 | $1,000 | $33,160 | $8,600 | $24,560 |
| 2017 | $837 | $27,740 | $6,300 | $21,440 |
| 2016 | $818 | $27,128 | $6,300 | $20,828 |
| 2015 | $824 | $27,280 | $6,451 | $20,828 |
| 2014 | $792 | $26,184 | $6,451 | $19,732 |
| 2013 | -- | $27,014 | $6,488 | $20,526 |
Source: Public Records
Map
Nearby Homes
- 201 S Chilton Crescent
- 203 S Chilton Crescent
- 732 Camellia Dr
- 102 Beech Creek Dr
- 724 Camellia Dr
- 106 Ewing St
- 204 Dixie Creek Dr
- 104 Sweetgum Dr
- 204 Colonial St
- 110 Russell St
- 806 New Franklin Rd
- 900 North St
- 114 Briarcliff Rd
- 222 Beechwood Cir
- 1784 Mooty Bridge Rd
- 1218 New Franklin Rd
- 109 Thomas St
- 134 S Page St
- 219 Banks St
- 202 Park Hill Dr
- 132 S Chilton Crescent
- 124 S Chilton Crescent
- 123 N Chilton Crescent
- 121 N Chilton Crescent
- S S Chilton Crescent Unit 6
- S S Chilton Crescent Unit 30/1/2OF31
- S S Chilton Crescent
- 123 S Chilton Crescent
- 125 S Chilton Crescent
- 125 N Chilton Crescent
- 119 N Chilton Crescent
- 131 S Chilton Crescent
- 120 S Chilton Crescent
- 136 S Chilton Crescent
- N N Chilton Crescent Unit 4
- N N Chilton Crescent
- 133 S Chilton Crescent
- 113 N Chilton Crescent
- 127 N Chilton Crescent
- 1016 Malibu Dr
Your Personal Tour Guide
Ask me questions while you tour the home.