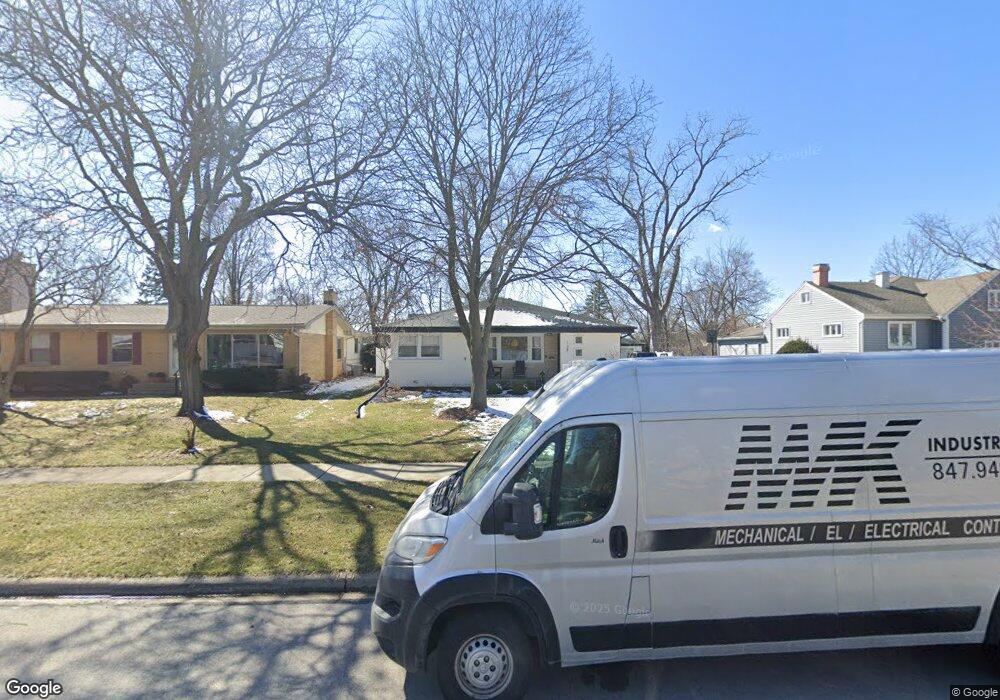
128 S Edgewood Ave Lombard, IL 60148
North Lombard NeighborhoodEstimated Value: $421,983 - $455,000
3
Beds
2
Baths
1,264
Sq Ft
$343/Sq Ft
Est. Value
About This Home
This home is located at 128 S Edgewood Ave, Lombard, IL 60148 and is currently estimated at $433,746, approximately $343 per square foot. 128 S Edgewood Ave is a home located in DuPage County with nearby schools including Westmore Elementary School, Jackson Middle School, and Willowbrook High School.
Ownership History
Date
Name
Owned For
Owner Type
Purchase Details
Closed on
Dec 20, 2007
Sold by
Nelson Dennis J
Bought by
Moen Mitchell A and Moen Dorothy L
Current Estimated Value
Home Financials for this Owner
Home Financials are based on the most recent Mortgage that was taken out on this home.
Original Mortgage
$318,250
Outstanding Balance
$197,764
Interest Rate
5.95%
Mortgage Type
Purchase Money Mortgage
Estimated Equity
$235,982
Purchase Details
Closed on
Nov 22, 2006
Sold by
Gillespie Paul A and Gillespie Kimberly S
Bought by
Nelson Dennis J
Purchase Details
Closed on
Apr 25, 2003
Sold by
Johnson Michael S and Fitzgerald Lawrence J
Bought by
Gillespie Paul A and Gillespie Kimberly S
Home Financials for this Owner
Home Financials are based on the most recent Mortgage that was taken out on this home.
Original Mortgage
$196,800
Interest Rate
5.88%
Mortgage Type
Purchase Money Mortgage
Purchase Details
Closed on
Oct 3, 2001
Sold by
Ellefson Joseph J and Old Kent Bank
Bought by
Fitzgerald Lawrence J and Johnson Michael S
Create a Home Valuation Report for This Property
The Home Valuation Report is an in-depth analysis detailing your home's value as well as a comparison with similar homes in the area
Home Values in the Area
Average Home Value in this Area
Purchase History
| Date | Buyer | Sale Price | Title Company |
|---|---|---|---|
| Moen Mitchell A | $335,000 | Atg | |
| Nelson Dennis J | $280,000 | Pntn | |
| Gillespie Paul A | $246,000 | Chicago Title Insurance Comp | |
| Fitzgerald Lawrence J | -- | -- |
Source: Public Records
Mortgage History
| Date | Status | Borrower | Loan Amount |
|---|---|---|---|
| Open | Moen Mitchell A | $318,250 | |
| Previous Owner | Gillespie Paul A | $196,800 |
Source: Public Records
Tax History Compared to Growth
Tax History
| Year | Tax Paid | Tax Assessment Tax Assessment Total Assessment is a certain percentage of the fair market value that is determined by local assessors to be the total taxable value of land and additions on the property. | Land | Improvement |
|---|---|---|---|---|
| 2024 | $8,210 | $119,495 | $31,858 | $87,637 |
| 2023 | $7,826 | $110,500 | $29,460 | $81,040 |
| 2022 | $7,568 | $106,220 | $28,320 | $77,900 |
| 2021 | $7,309 | $103,580 | $27,620 | $75,960 |
| 2020 | $7,158 | $101,310 | $27,010 | $74,300 |
| 2019 | $6,738 | $96,320 | $25,680 | $70,640 |
| 2018 | $6,257 | $85,810 | $29,460 | $56,350 |
| 2017 | $6,100 | $81,770 | $28,070 | $53,700 |
| 2016 | $6,017 | $77,030 | $26,440 | $50,590 |
| 2015 | $5,990 | $74,740 | $24,630 | $50,110 |
| 2014 | $6,411 | $79,170 | $30,340 | $48,830 |
| 2013 | $6,314 | $80,290 | $30,770 | $49,520 |
Source: Public Records
Map
Nearby Homes
- 216 S Edgewood Ave
- 634 E Emerson Ave
- 82 S Lodge Ln
- 125 S Chase Ave
- 208 S Highland Ave
- 118 S Highland Ave
- 328 S Grace St
- 313 S Lombard Ave
- 528 E Washington Blvd
- 736 E Saint Charles Rd
- 415 S Highland Ave
- 912 E Saint Charles Rd
- 131 N Chase Ave
- 201 N Stewart Ave
- 935 E Saint Charles Rd
- 570 S Fairfield Ave
- 107 S Charlotte St
- 434 N Highland Ave
- 252 N Lombard Ave
- 105 E Grove St
- 124 S Edgewood Ave
- 134 S Edgewood Ave
- 190 S Edgewood Ave
- 536 E Maple St
- 135 S Edgewood Ave
- 127 S Edgewood Ave
- 123 S Edgewood Ave
- 604 E Maple St
- 119 S Edgewood Ave
- 115 S Edgewood Ave
- 109 S Edgewood Ave
- 603 E Maple St
- 603 E Maple St
- 134 S Lewis Ave
- 130 S Lewis Ave
- 105 S Edgewood Ave
- 122 S Lewis Ave
- 620 E Maple St
- 118 S Lewis Ave
- 212 S Edgewood Ave