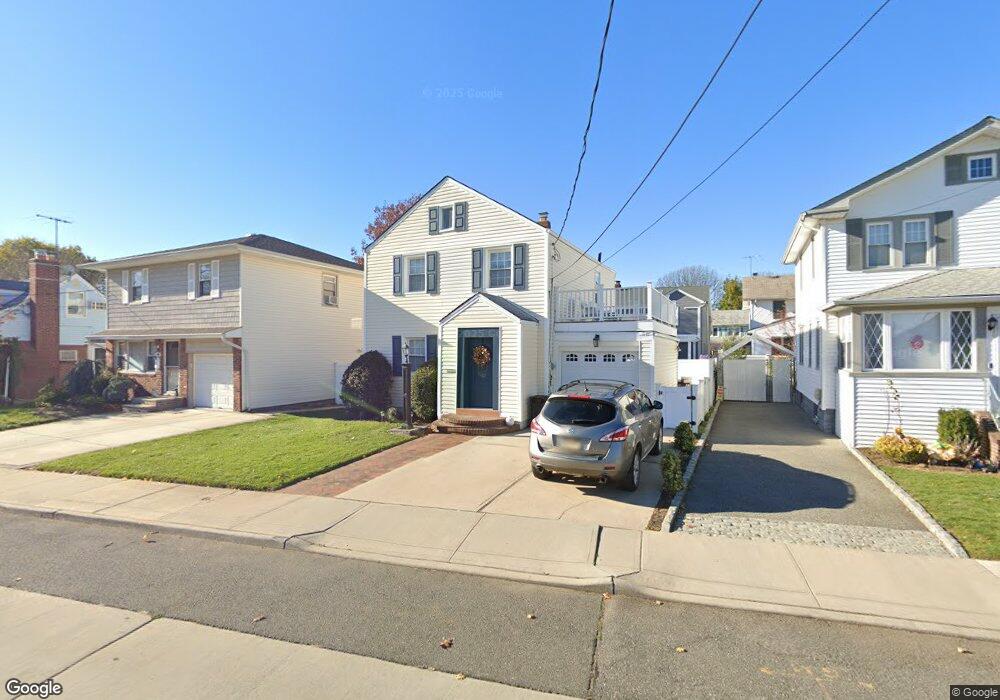
128 S Forest Ave Rockville Centre, NY 11570
Estimated Value: $741,303 - $750,000
3
Beds
2
Baths
1,347
Sq Ft
$554/Sq Ft
Est. Value
About This Home
This home is located at 128 S Forest Ave, Rockville Centre, NY 11570 and is currently estimated at $745,652, approximately $553 per square foot. 128 S Forest Ave is a home located in Nassau County with nearby schools including North Oceanside Elementary School 5, Oceanside Middle School, and Oceanside High School.
Ownership History
Date
Name
Owned For
Owner Type
Purchase Details
Closed on
Dec 27, 2016
Sold by
Navalany Richard J and Schrynemakers Ilse M
Bought by
Shannon Thomas and Shannon Margaret
Current Estimated Value
Home Financials for this Owner
Home Financials are based on the most recent Mortgage that was taken out on this home.
Original Mortgage
$100,000
Outstanding Balance
$15,800
Interest Rate
4.08%
Mortgage Type
New Conventional
Estimated Equity
$729,852
Purchase Details
Closed on
Jan 27, 2011
Sold by
Chan Calvin
Bought by
Navalany Richard
Home Financials for this Owner
Home Financials are based on the most recent Mortgage that was taken out on this home.
Original Mortgage
$364,500
Interest Rate
4.88%
Mortgage Type
Purchase Money Mortgage
Purchase Details
Closed on
Nov 16, 2007
Sold by
Guarascio Gaetano
Bought by
Chan Calvin
Create a Home Valuation Report for This Property
The Home Valuation Report is an in-depth analysis detailing your home's value as well as a comparison with similar homes in the area
Home Values in the Area
Average Home Value in this Area
Purchase History
| Date | Buyer | Sale Price | Title Company |
|---|---|---|---|
| Shannon Thomas | $438,000 | Tradition Title Agency Inc | |
| Navalany Richard | $405,000 | -- | |
| Chan Calvin | $385,000 | -- |
Source: Public Records
Mortgage History
| Date | Status | Borrower | Loan Amount |
|---|---|---|---|
| Open | Shannon Thomas | $100,000 | |
| Previous Owner | Navalany Richard | $364,500 |
Source: Public Records
Tax History Compared to Growth
Tax History
| Year | Tax Paid | Tax Assessment Tax Assessment Total Assessment is a certain percentage of the fair market value that is determined by local assessors to be the total taxable value of land and additions on the property. | Land | Improvement |
|---|---|---|---|---|
| 2025 | $12,000 | $567 | $176 | $391 |
| 2024 | $1,207 | $567 | $176 | $391 |
| 2023 | $10,730 | $567 | $176 | $391 |
| 2022 | $10,730 | $567 | $176 | $391 |
| 2021 | $15,199 | $548 | $170 | $378 |
| 2020 | $10,435 | $657 | $484 | $173 |
| 2019 | $8,845 | $657 | $484 | $173 |
| 2018 | $8,375 | $913 | $0 | $0 |
| 2017 | $7,691 | $913 | $672 | $241 |
| 2016 | $9,061 | $913 | $672 | $241 |
| 2015 | $1,319 | $913 | $665 | $248 |
| 2014 | $1,319 | $913 | $665 | $248 |
| 2013 | $1,246 | $913 | $672 | $241 |
Source: Public Records
Map
Nearby Homes
- 274 Lincoln Ave
- 89 S Kensington Ave
- 55 Vernon Ave
- 172 S Kensington Ave
- 4 S Forest Ave Unit B
- 110 Driscoll Ave
- 11 S Marion Place
- 414 Merrick Rd Unit 4.5B
- 400 Merrick Rd Unit 5A
- 32 Smith St
- 401 Merrick Rd
- 2814 Weeks Ave
- 25 Lenox Rd Unit 2
- 43 N Forest Ave Unit E21
- 46 Ongley St
- 77 S Park Ave Unit C-20
- 77 S Park Ave Unit A24
- 33 Nassau Pkwy
- 70 S Park Ave Unit 114
- 70 S Park Ave Unit 112
- 130 S Forest Ave
- 124 S Forest Ave
- 122 S Forest Ave
- 46 Rockville Ave
- 44 Rockville Ave
- 136 S Forest Ave
- 48 Rockville Ave
- 42 Rockville Ave
- 133 S Forest Ave
- 50 Rockville Ave
- 125 S Forest Ave
- 137 S Forest Ave
- 52 Rockville Ave
- 40 Rockville Ave
- 40 Rockville Ave Unit Main
- 140 S Forest Ave
- 143 S Forest Ave
- 121 S Forest Ave
- 32 Rockville Ave
- 58 Rockville Ave