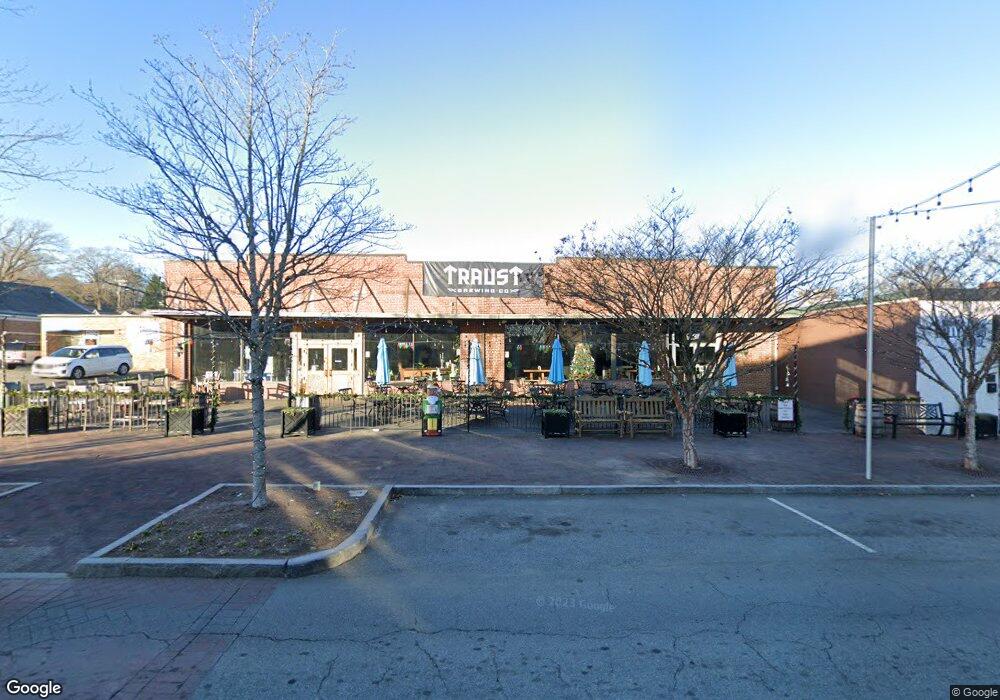
128 S Main St Mount Holly, NC 28120
--
Bed
--
Bath
10,400
Sq Ft
1.2
Acres
About This Home
This home is located at 128 S Main St, Mount Holly, NC 28120. 128 S Main St is a home located in Gaston County with nearby schools including Rankin Elementary School, Mount Holly Middle School, and Stuart W. Cramer High School.
Ownership History
Date
Name
Owned For
Owner Type
Purchase Details
Closed on
Jul 8, 2021
Sold by
Filos Llc
Bought by
Mhnc Main Holdings Llc
Home Financials for this Owner
Home Financials are based on the most recent Mortgage that was taken out on this home.
Original Mortgage
$1,189,000
Outstanding Balance
$1,045,856
Interest Rate
2.96%
Mortgage Type
Small Business Administration
Purchase Details
Closed on
Nov 18, 2019
Sold by
Housiadas George S and Housiadas Maria D
Bought by
Filos Llc
Purchase Details
Closed on
Mar 16, 2015
Sold by
City Cafe Realty Llc
Bought by
Filos Llc and Housiadas George
Purchase Details
Closed on
Jun 1, 2005
Sold by
Mckenney Investments Llc and Willis James Donald
Bought by
City Cafe Realty Llc
Home Financials for this Owner
Home Financials are based on the most recent Mortgage that was taken out on this home.
Original Mortgage
$715,500
Interest Rate
5.74%
Mortgage Type
Commercial
Purchase Details
Closed on
Mar 1, 2005
Sold by
Jones John E and Jones Diana W
Bought by
Mckenney Investments Llc
Create a Home Valuation Report for This Property
The Home Valuation Report is an in-depth analysis detailing your home's value as well as a comparison with similar homes in the area
Home Values in the Area
Average Home Value in this Area
Purchase History
| Date | Buyer | Sale Price | Title Company |
|---|---|---|---|
| Mhnc Main Holdings Llc | $1,020,000 | None Available | |
| Filos Llc | $130,000 | None Available | |
| Filos Llc | $450,000 | None Available | |
| City Cafe Realty Llc | $495,000 | -- | |
| Mckenney Investments Llc | $150,000 | -- |
Source: Public Records
Mortgage History
| Date | Status | Borrower | Loan Amount |
|---|---|---|---|
| Open | Mhnc Main Holdings Llc | $1,189,000 | |
| Previous Owner | City Cafe Realty Llc | $715,500 |
Source: Public Records
Tax History Compared to Growth
Tax History
| Year | Tax Paid | Tax Assessment Tax Assessment Total Assessment is a certain percentage of the fair market value that is determined by local assessors to be the total taxable value of land and additions on the property. | Land | Improvement |
|---|---|---|---|---|
| 2025 | $11,239 | $1,119,470 | $313,340 | $806,130 |
| 2024 | $11,239 | $1,119,470 | $313,340 | $806,130 |
| 2023 | $11,363 | $1,119,470 | $313,340 | $806,130 |
| 2022 | $9,448 | $729,610 | $256,750 | $472,860 |
| 2021 | $9,594 | $729,610 | $256,750 | $472,860 |
| 2019 | $9,667 | $729,610 | $256,750 | $472,860 |
| 2018 | $8,451 | $603,638 | $256,561 | $347,077 |
| 2017 | $8,451 | $603,638 | $256,561 | $347,077 |
| 2016 | $5,252 | $603,638 | $0 | $0 |
| 2014 | $5,787 | $665,170 | $278,561 | $386,609 |
Source: Public Records
Map
Nearby Homes
- 227 W Glendale Ave
- 217 Highland St
- 201 1st St
- 413 W Glendale Ave
- 408 E Catawba Ave
- 422 Wilson St
- 225 N Lee St
- 621 Herms Ave
- 609 Elm St
- 613 Elm St
- 3631 Azalea Ridge Dr
- 101 Madison Dr
- 703 Rankin Ave
- 101 Loya St
- 504 N Hawthorne St
- 00 Bell St
- 117 Quality Dr
- 113 S Mulberry Ct
- 105 S Tanninger Rd
- 904 Timberlane Dr
- 126 S Main St
- 122 S Main St
- 119 S Main St
- 133 Oakland St
- 145 Oakland St
- 129 Kendrick Ct
- 125 Oakland St
- 121 W Central Ave
- 117 Oakland St
- 1209 Mason Way
- 1213 Mason Way
- 1211 Mason Way
- 157 Oakland St
- 119 W Central Ave
- 119 Oakland St
- 115 Oakland St
- 129 W Central Ave
- 122 E Central Ave Unit A
- 122 E Central Ave Unit E
- 122 E Central Ave Unit B