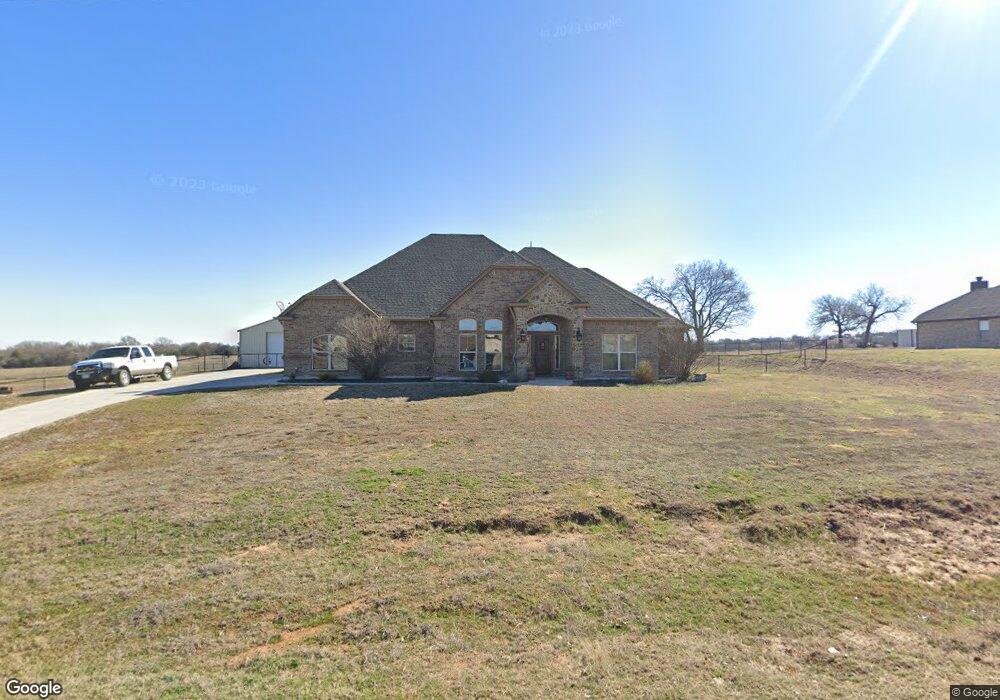
128 Spring Meadow Dr Springtown, TX 76082
Estimated Value: $521,000 - $551,000
3
Beds
2
Baths
2,249
Sq Ft
$238/Sq Ft
Est. Value
About This Home
This home is located at 128 Spring Meadow Dr, Springtown, TX 76082 and is currently estimated at $535,751, approximately $238 per square foot. 128 Spring Meadow Dr is a home located in Parker County with nearby schools including Goshen Creek Elementary School, Springtown Middle School, and Springtown Intermediate School.
Ownership History
Date
Name
Owned For
Owner Type
Purchase Details
Closed on
Sep 27, 2016
Sold by
Duncan Custom Homes Llc
Bought by
Gilliland Sterling and Gilliland Kristie
Current Estimated Value
Home Financials for this Owner
Home Financials are based on the most recent Mortgage that was taken out on this home.
Original Mortgage
$255,455
Outstanding Balance
$204,600
Interest Rate
3.43%
Mortgage Type
Purchase Money Mortgage
Estimated Equity
$331,151
Purchase Details
Closed on
Apr 18, 2016
Sold by
Caj Investments Llc
Bought by
Gilliland Sterling and Gilliland Kristie
Home Financials for this Owner
Home Financials are based on the most recent Mortgage that was taken out on this home.
Original Mortgage
$204,000
Interest Rate
3.68%
Mortgage Type
Purchase Money Mortgage
Create a Home Valuation Report for This Property
The Home Valuation Report is an in-depth analysis detailing your home's value as well as a comparison with similar homes in the area
Home Values in the Area
Average Home Value in this Area
Purchase History
| Date | Buyer | Sale Price | Title Company |
|---|---|---|---|
| Gilliland Sterling | -- | Fnt | |
| Gilliland Sterling | -- | -- | |
| Duncan Custom Homes Llc | -- | Attorney |
Source: Public Records
Mortgage History
| Date | Status | Borrower | Loan Amount |
|---|---|---|---|
| Open | Gilliland Sterling | $255,455 | |
| Previous Owner | Duncan Custom Homes Llc | $204,000 |
Source: Public Records
Tax History
| Year | Tax Paid | Tax Assessment Tax Assessment Total Assessment is a certain percentage of the fair market value that is determined by local assessors to be the total taxable value of land and additions on the property. | Land | Improvement |
|---|---|---|---|---|
| 2025 | $6,654 | $538,090 | $85,000 | $453,090 |
| 2024 | $6,654 | $490,897 | -- | -- |
| 2023 | $6,654 | $446,270 | $0 | $0 |
| 2022 | $7,234 | $408,150 | $50,000 | $358,150 |
| 2021 | $7,139 | $408,150 | $50,000 | $358,150 |
| 2020 | $6,469 | $335,290 | $40,000 | $295,290 |
| 2019 | $6,953 | $335,290 | $40,000 | $295,290 |
Source: Public Records
Map
Nearby Homes
- 8496 Lavender
- 3275 W Highway 199
- 163 Agnes Cir
- 125 Agnes Cir
- 2764 W Highway 199
- 8140 Lavender Rd
- 144 Brady Coleman Ln
- 533 Eagles Way
- 118 Kenya Ct
- 2151 W Highway 199
- TBD Candis Ct
- 104 Candis Ct
- 137 Brady Coleman Ln
- 240 Springwood Ranch Loop
- 1008 Ronnie Ct
- 1017 Ronnie Ct
- 2000 Atticus Ct
- 121 Windy Creek Ct
- 1013 Magnolia Ct
- 104 Maudy Ln
- 132 Spring Meadow Dr
- 124 Spring Meadow Dr
- 133 Spring Meadow Dr
- 120 Spring Meadow Dr
- 302 Spring View Ct
- 116 Spring Meadow Dr
- 116 Spring Meadow Dr
- 116 Spring Meadow Dr
- 304 Spring View Ct
- 145 Spring Meadow Dr
- 140 Spring Meadow Dr
- 3350 Goshen Rd
- 301 Spring View Ct
- 165 Spring Meadow Dr
- 161 Spring Meadow Dr
- 112 Spring Meadow Dr
- 112 Spring Meadow Dr
- 112 Spring Meadow Dr
- 308 Spring View Ct
- 157 Spring Meadow Dr
Your Personal Tour Guide
Ask me questions while you tour the home.