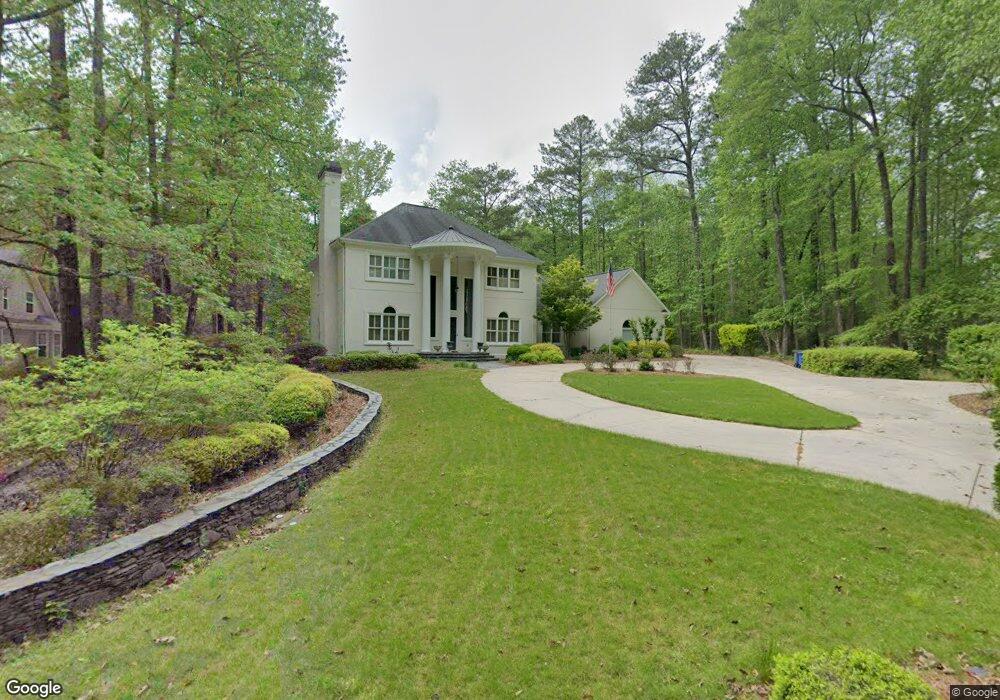
128 Stillwater Trace Griffin, GA 30223
Spalding County NeighborhoodEstimated Value: $451,000 - $567,000
4
Beds
4
Baths
3,945
Sq Ft
$128/Sq Ft
Est. Value
About This Home
This home is located at 128 Stillwater Trace, Griffin, GA 30223 and is currently estimated at $505,049, approximately $128 per square foot. 128 Stillwater Trace is a home located in Spalding County with nearby schools including Orrs Elementary School, Carver Road Middle School, and Griffin High School.
Ownership History
Date
Name
Owned For
Owner Type
Purchase Details
Closed on
Jan 28, 2022
Sold by
Eubanks Teresa
Bought by
Orlando Martin and Orlando Veronica
Current Estimated Value
Home Financials for this Owner
Home Financials are based on the most recent Mortgage that was taken out on this home.
Original Mortgage
$422,750
Outstanding Balance
$392,603
Interest Rate
3.56%
Mortgage Type
Cash
Estimated Equity
$112,446
Purchase Details
Closed on
Mar 22, 2019
Sold by
Patel Pyush
Bought by
Eubanks Teresa
Home Financials for this Owner
Home Financials are based on the most recent Mortgage that was taken out on this home.
Original Mortgage
$243,000
Interest Rate
4.3%
Mortgage Type
New Conventional
Purchase Details
Closed on
Dec 3, 1991
Sold by
Murray G Niles
Bought by
Patel Pyush
Purchase Details
Closed on
Sep 9, 1991
Sold by
Wilson E D
Bought by
Murray G Niles
Purchase Details
Closed on
Sep 16, 1988
Sold by
Remington D Brian
Bought by
Wilson E D
Create a Home Valuation Report for This Property
The Home Valuation Report is an in-depth analysis detailing your home's value as well as a comparison with similar homes in the area
Home Values in the Area
Average Home Value in this Area
Purchase History
| Date | Buyer | Sale Price | Title Company |
|---|---|---|---|
| Orlando Martin | $445,000 | -- | |
| Eubanks Teresa | $270,000 | -- | |
| Patel Pyush | $56,500 | -- | |
| Murray G Niles | $50,000 | -- | |
| Wilson E D | $50,000 | -- |
Source: Public Records
Mortgage History
| Date | Status | Borrower | Loan Amount |
|---|---|---|---|
| Open | Orlando Martin | $422,750 | |
| Previous Owner | Eubanks Teresa | $243,000 |
Source: Public Records
Tax History Compared to Growth
Tax History
| Year | Tax Paid | Tax Assessment Tax Assessment Total Assessment is a certain percentage of the fair market value that is determined by local assessors to be the total taxable value of land and additions on the property. | Land | Improvement |
|---|---|---|---|---|
| 2024 | $6,762 | $179,405 | $19,200 | $160,205 |
| 2023 | $6,762 | $179,405 | $19,200 | $160,205 |
| 2022 | $6,495 | $164,876 | $19,200 | $145,676 |
| 2021 | $5,046 | $128,610 | $19,200 | $109,410 |
| 2020 | $5,140 | $128,610 | $19,200 | $109,410 |
| 2019 | $4,618 | $115,826 | $19,200 | $96,626 |
| 2018 | $4,405 | $106,638 | $19,200 | $87,438 |
| 2017 | $4,310 | $106,638 | $19,200 | $87,438 |
| 2016 | $4,379 | $106,638 | $19,200 | $87,438 |
| 2015 | $4,451 | $106,638 | $19,200 | $87,438 |
| 2014 | $4,585 | $106,638 | $19,200 | $87,438 |
Source: Public Records
Map
Nearby Homes
- 106 Cheshire Dr
- 228 Westchester Dr
- 1851 Abbey Rd
- 425 Audubon Cir
- 1818 Abbey Rd
- 1833 Abbey Rd
- 1044 W Ellis Rd
- 312 Ac W Ellis Rd
- 0 N Pine Hill Rd Unit 10465642
- 0 N Pine Hill Rd Unit 10465641
- 0 N Pine Hill Rd Unit 10465639
- 0 N Pine Hill Rd Unit 10465638
- 0 N Pine Hill Rd Unit 10465637
- 1725 Wesminster Cir
- 405 N Pine Hill Rd
- 1725 Wesminster Dr
- 200 Ac W Ellis Rd
- 0 Westmoreland Rd Unit 10545005
- TRACT A Newnan Rd
- 223 Patriots Way
- 128 Stillwater Trace Unit 9
- 132 Stillwater Trace
- 126 Stillwater Trace
- 116 Stillwater Trace
- 134 Stillwater Trace
- 114 Stillwater Trace
- 144 Stillwater Trace
- 136 Stillwater Trace
- 148 Stillwater Trace
- 0 Cheshire Dr Unit LOT 13 8415467
- 0 Cheshire Dr Unit LOT 18 8415458
- 0 Cheshire Dr Unit LOT 25 8415454
- 0 Cheshire Dr Unit LOT 13 8415447
- 0 Cheshire Dr Unit LOT 5 8415445
- 0 Cheshire Dr Unit LOT 4 8415442
- 0 Cheshire Dr Unit LOT 3 8415439
- 0 Cheshire Dr Unit 2 8415433
- 0 Cheshire Dr Unit 2 8204054
- 0 Cheshire Dr Unit 2890146
- 0 Cheshire Dr Unit LOT 5 7188381