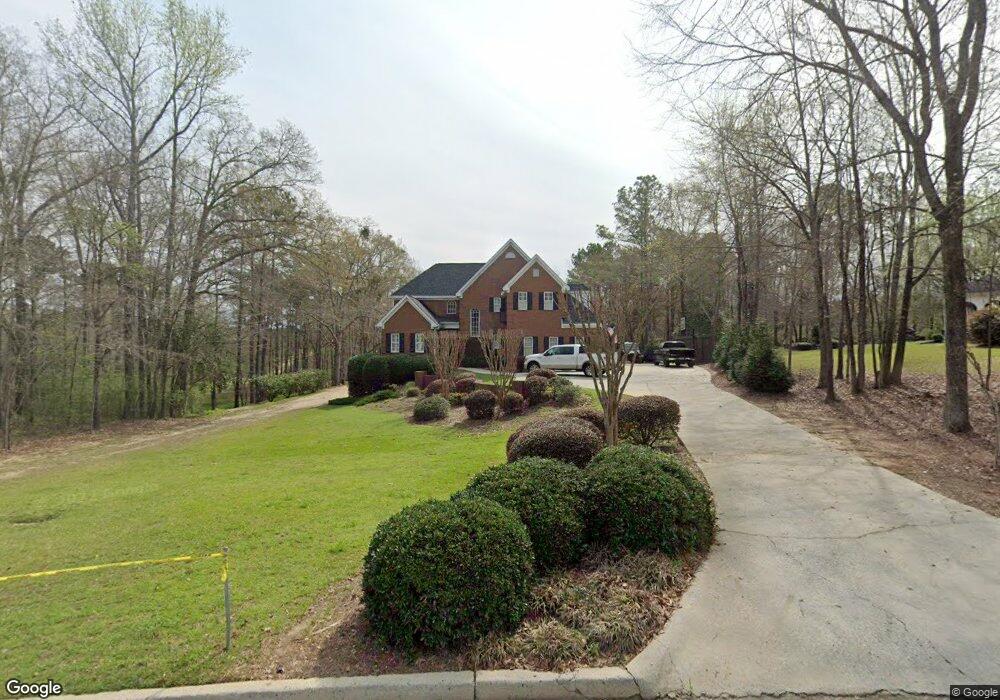
128 Treyburne Way Macon, GA 31210
Estimated Value: $490,000 - $842,000
4
Beds
5
Baths
2,859
Sq Ft
$223/Sq Ft
Est. Value
About This Home
This home is located at 128 Treyburne Way, Macon, GA 31210 and is currently estimated at $637,151, approximately $222 per square foot. 128 Treyburne Way is a home located in Bibb County with nearby schools including Carter Elementary School, Howard Middle School, and Howard High School.
Ownership History
Date
Name
Owned For
Owner Type
Purchase Details
Closed on
Jun 24, 2019
Sold by
Rowland Christy E
Bought by
Rowland Mark Daniel and Rowland Christy Ellis
Current Estimated Value
Home Financials for this Owner
Home Financials are based on the most recent Mortgage that was taken out on this home.
Original Mortgage
$320,000
Outstanding Balance
$275,679
Interest Rate
3.25%
Mortgage Type
Adjustable Rate Mortgage/ARM
Estimated Equity
$361,472
Purchase Details
Closed on
Aug 3, 2011
Sold by
Rowland Mark D and Rowland Christy E
Bought by
Rowland Christy E
Purchase Details
Closed on
Sep 1, 2005
Sold by
Durden William F and Durden Jodi T
Bought by
Rowland Mark D and Rowland Christy E
Home Financials for this Owner
Home Financials are based on the most recent Mortgage that was taken out on this home.
Original Mortgage
$275,000
Interest Rate
5.71%
Mortgage Type
New Conventional
Purchase Details
Closed on
Feb 15, 2002
Purchase Details
Closed on
Apr 24, 1998
Create a Home Valuation Report for This Property
The Home Valuation Report is an in-depth analysis detailing your home's value as well as a comparison with similar homes in the area
Home Values in the Area
Average Home Value in this Area
Purchase History
| Date | Buyer | Sale Price | Title Company |
|---|---|---|---|
| Rowland Mark Daniel | -- | None Available | |
| Rowland Christy E | -- | -- | |
| Rowland Mark D | $355,000 | None Available | |
| -- | $330,000 | -- | |
| -- | $266,800 | -- |
Source: Public Records
Mortgage History
| Date | Status | Borrower | Loan Amount |
|---|---|---|---|
| Open | Rowland Mark Daniel | $320,000 | |
| Previous Owner | Rowland Mark D | $275,000 |
Source: Public Records
Tax History Compared to Growth
Tax History
| Year | Tax Paid | Tax Assessment Tax Assessment Total Assessment is a certain percentage of the fair market value that is determined by local assessors to be the total taxable value of land and additions on the property. | Land | Improvement |
|---|---|---|---|---|
| 2025 | $5,034 | $211,868 | $41,984 | $169,884 |
| 2024 | $5,203 | $211,868 | $41,984 | $169,884 |
| 2023 | $4,746 | $211,868 | $41,984 | $169,884 |
| 2022 | $5,850 | $175,969 | $24,157 | $151,812 |
| 2021 | $5,191 | $143,614 | $23,453 | $120,161 |
| 2020 | $5,304 | $143,614 | $23,453 | $120,161 |
| 2019 | $5,348 | $143,614 | $23,453 | $120,161 |
| 2018 | $8,370 | $143,614 | $23,453 | $120,161 |
| 2017 | $5,118 | $143,614 | $23,453 | $120,161 |
| 2016 | $4,726 | $143,614 | $23,453 | $120,161 |
| 2015 | $6,650 | $142,786 | $23,453 | $119,332 |
| 2014 | $6,660 | $142,786 | $23,453 | $119,332 |
Source: Public Records
Map
Nearby Homes
- 117 Legare Ct
- 4971 Ayers Rd
- 1153 Saint Andrews Dr
- 715 Ivy Brook Way
- 776 Ivy Brook Way
- 785 Ivy Brook Way
- 631 Ivy Brook Way
- 2006 Fall Harvest Dr Unit LOT 278
- 2002 Fall Harvest Dr Unit LOT 280
- 2006 Fall Harvest Dr
- 2002 Fall Harvest Dr
- 2008 Fall Harvest Dr Unit LOT 277
- 2004 Fall Harvest Dr
- 2010 Fall Harvest Dr Unit LOT 276
- 2010 Fall Harvest Dr
- 2004 Fall Harvest Dr Unit LOT 279
- 301 Treyburne Ct
- 305 Treyburne Ct
- 125 Treyburne Way
- 130 Treyburne Way
- 0 Treyburne Ct Unit 8820769
- 0 Treyburne Ct
- 129 Treyburne Way
- 300 Treyburne Ct
- 304 Treyburne Ct
- 121 Treyburne Way
- 309 Treyburne Ct
- 308 Treyburne Ct
- 117 Treyburne Way
- 312 Treyburne Ct
- 4850 Ayers Rd
- 313 Treyburne Ct
- 113 Treyburne Way
- 201 Hampton Ct
- 205 Hampton Ct
- 4938 Ayers Rd