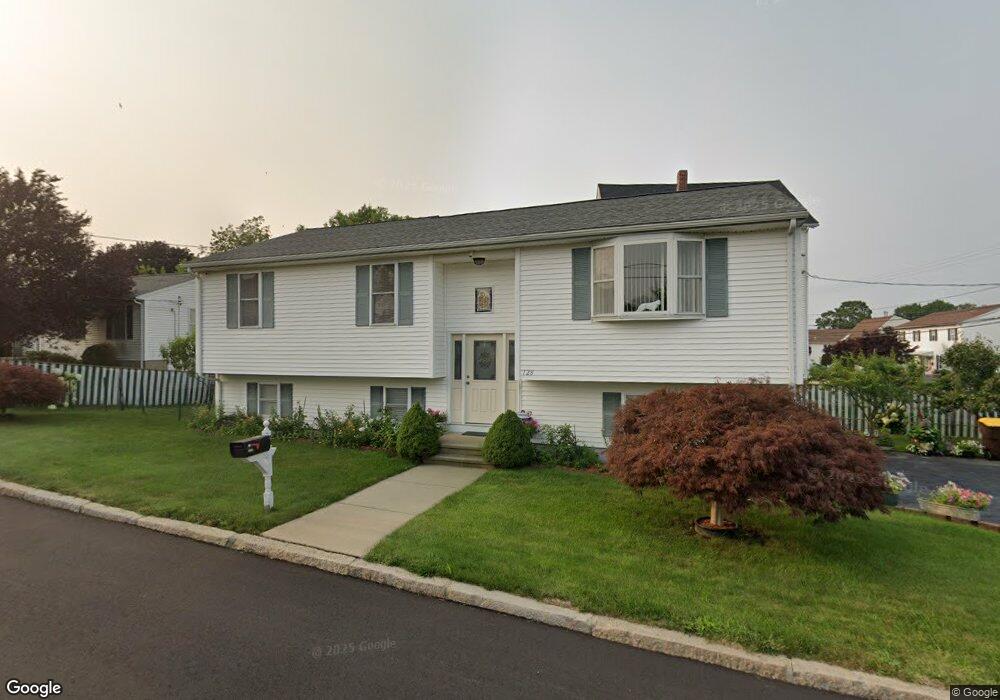
128 Tucker St Fall River, MA 02724
Father Kelly NeighborhoodEstimated Value: $475,854 - $518,000
3
Beds
2
Baths
2,099
Sq Ft
$238/Sq Ft
Est. Value
About This Home
This home is located at 128 Tucker St, Fall River, MA 02724 and is currently estimated at $498,964, approximately $237 per square foot. 128 Tucker St is a home located in Bristol County with nearby schools including Henry Lord Community School, B M C Durfee High School, and Argosy Collegiate Charter School.
Ownership History
Date
Name
Owned For
Owner Type
Purchase Details
Closed on
Aug 30, 2007
Sold by
Feijo Manuel and Feijo Maria B
Bought by
Feijo-Mendonca Bella and Feijo-Botelho Elsa
Current Estimated Value
Purchase Details
Closed on
Apr 8, 1999
Sold by
Patenaude Joyce A
Bought by
Ying-Wang Ke
Home Financials for this Owner
Home Financials are based on the most recent Mortgage that was taken out on this home.
Original Mortgage
$90,000
Interest Rate
6.83%
Mortgage Type
Purchase Money Mortgage
Purchase Details
Closed on
Aug 1, 1997
Sold by
Arruda David J and Arruda Rosemary
Bought by
Patenaude Joyce A
Create a Home Valuation Report for This Property
The Home Valuation Report is an in-depth analysis detailing your home's value as well as a comparison with similar homes in the area
Home Values in the Area
Average Home Value in this Area
Purchase History
| Date | Buyer | Sale Price | Title Company |
|---|---|---|---|
| Feijo-Mendonca Bella | -- | -- | |
| Ying-Wang Ke | $120,000 | -- | |
| Patenaude Joyce A | $39,000 | -- |
Source: Public Records
Mortgage History
| Date | Status | Borrower | Loan Amount |
|---|---|---|---|
| Previous Owner | Patenaude Joyce A | $90,000 |
Source: Public Records
Tax History
| Year | Tax Paid | Tax Assessment Tax Assessment Total Assessment is a certain percentage of the fair market value that is determined by local assessors to be the total taxable value of land and additions on the property. | Land | Improvement |
|---|---|---|---|---|
| 2025 | $4,738 | $413,800 | $126,200 | $287,600 |
| 2024 | $4,208 | $366,200 | $121,400 | $244,800 |
| 2023 | $4,184 | $341,000 | $104,100 | $236,900 |
| 2022 | $3,599 | $285,200 | $94,600 | $190,600 |
| 2021 | $3,713 | $259,800 | $87,600 | $172,200 |
| 2020 | $3,612 | $241,800 | $83,800 | $158,000 |
| 2019 | $4,139 | $237,800 | $79,800 | $158,000 |
| 2018 | $3,667 | $225,200 | $78,300 | $146,900 |
| 2017 | $3,583 | $221,600 | $79,900 | $141,700 |
| 2016 | $2,840 | $208,400 | $83,200 | $125,200 |
| 2015 | $2,730 | $208,700 | $80,200 | $128,500 |
| 2014 | $2,678 | $212,900 | $84,400 | $128,500 |
Source: Public Records
Map
Nearby Homes
Your Personal Tour Guide
Ask me questions while you tour the home.