Estimated Value: $550,000 - $666,000
4
Beds
3
Baths
2,214
Sq Ft
$280/Sq Ft
Est. Value
About This Home
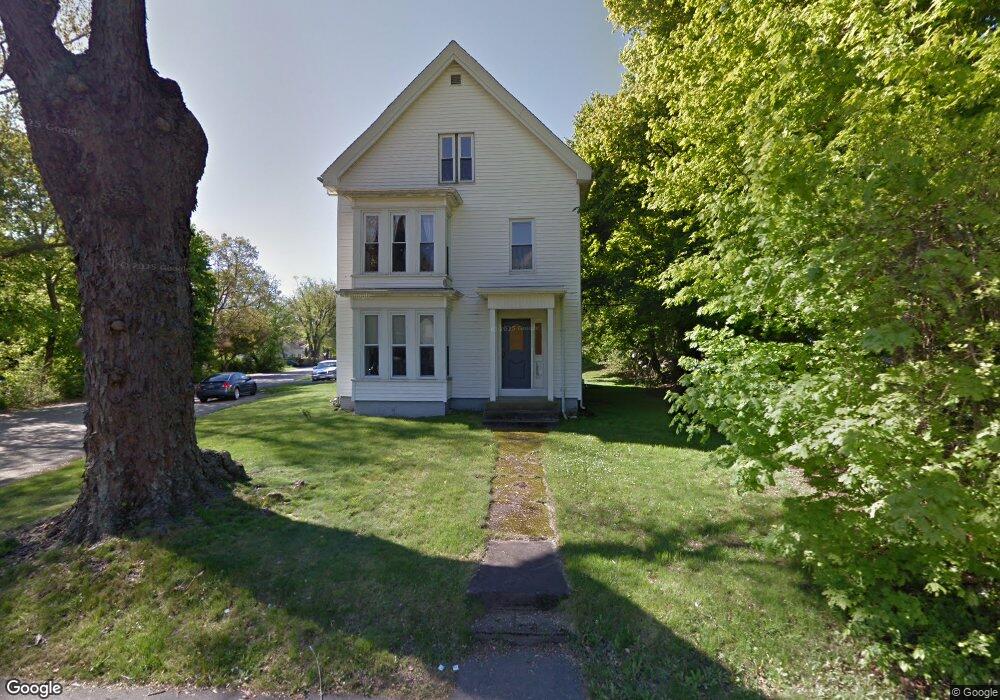
This home is located at 128 W High St, Avon, MA 02322 and is currently estimated at $621,000, approximately $280 per square foot. 128 W High St is a home located in Norfolk County with nearby schools including Ralph D. Butler Elementary School, Avon Middle/High School, and Lighthouse Baptist Christian Academy.
Ownership History
Date
Name
Owned For
Owner Type
Purchase Details
Closed on
Jun 12, 2024
Sold by
Campbell Charlotte C
Bought by
Alexander Campbell T and Alexander Campbell
Current Estimated Value
Purchase Details
Closed on
Jun 30, 2016
Sold by
Campbell Alexander and Campbell Charlotte C
Bought by
Campbell Charotte C
Purchase Details
Closed on
Jul 31, 1978
Bought by
Campbell Alexander and Campbell Charlotte C
Create a Home Valuation Report for This Property
The Home Valuation Report is an in-depth analysis detailing your home's value as well as a comparison with similar homes in the area
Home Values in the Area
Average Home Value in this Area
Purchase History
| Date | Buyer | Sale Price | Title Company |
|---|---|---|---|
| Alexander Campbell T | -- | None Available | |
| Alexander Campbell T | -- | None Available | |
| Campbell Charotte C | -- | -- | |
| Campbell Charotte C | -- | -- | |
| Campbell Alexander | -- | -- |
Source: Public Records
Tax History
| Year | Tax Paid | Tax Assessment Tax Assessment Total Assessment is a certain percentage of the fair market value that is determined by local assessors to be the total taxable value of land and additions on the property. | Land | Improvement |
|---|---|---|---|---|
| 2025 | $57 | $430,900 | $181,200 | $249,700 |
| 2024 | $5,914 | $421,500 | $171,800 | $249,700 |
| 2023 | $5,741 | $421,500 | $171,800 | $249,700 |
| 2022 | $5,271 | $333,400 | $143,100 | $190,300 |
| 2021 | $4,912 | $292,700 | $129,800 | $162,900 |
| 2020 | $5,119 | $289,200 | $127,400 | $161,800 |
| 2019 | $5,260 | $292,400 | $127,400 | $165,000 |
| 2018 | $5,424 | $292,400 | $127,400 | $165,000 |
| 2017 | $5,068 | $293,300 | $127,400 | $165,900 |
| 2016 | $4,734 | $276,700 | $127,300 | $149,400 |
| 2015 | $4,340 | $265,100 | $115,700 | $149,400 |
Source: Public Records
Map
Nearby Homes
Your Personal Tour Guide
Ask me questions while you tour the home.