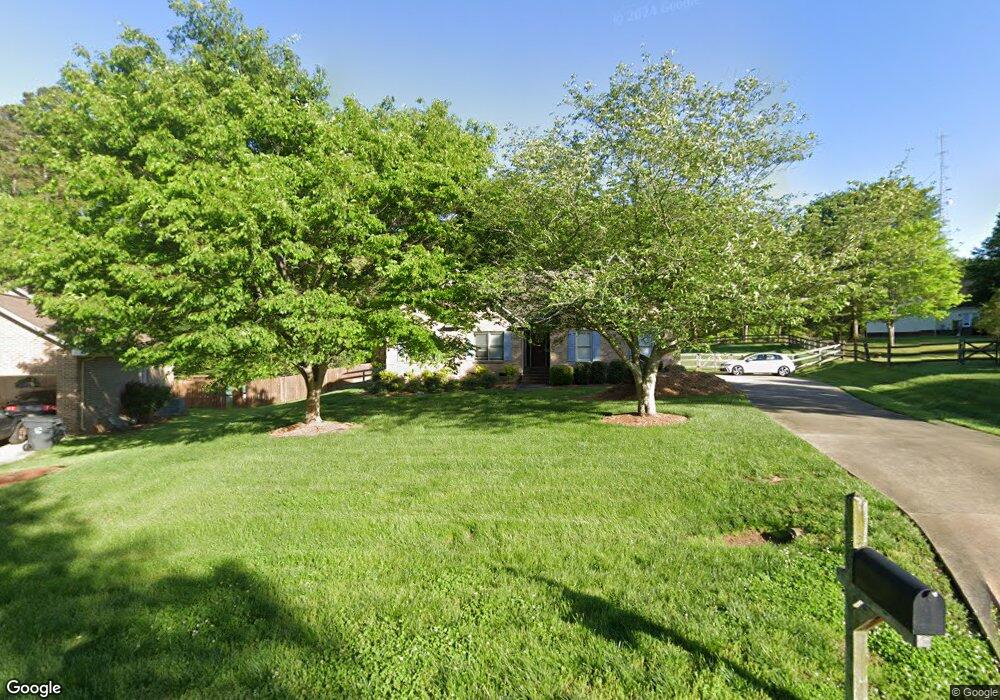
128 Walking Horse Run Stanley, NC 28164
Estimated Value: $338,277 - $390,000
4
Beds
2
Baths
1,671
Sq Ft
$217/Sq Ft
Est. Value
About This Home
This home is located at 128 Walking Horse Run, Stanley, NC 28164 and is currently estimated at $362,569, approximately $216 per square foot. 128 Walking Horse Run is a home located in Gaston County with nearby schools including Springfield Primary School, Kiser Elementary School, and Stanley Middle School.
Ownership History
Date
Name
Owned For
Owner Type
Purchase Details
Closed on
May 13, 2020
Sold by
Brunner Cory D and Brunner Cory
Bought by
Brunner Cory and Brunner Jamila
Current Estimated Value
Home Financials for this Owner
Home Financials are based on the most recent Mortgage that was taken out on this home.
Original Mortgage
$176,000
Outstanding Balance
$122,824
Interest Rate
3.2%
Mortgage Type
New Conventional
Estimated Equity
$239,745
Purchase Details
Closed on
Feb 13, 2002
Sold by
Michael Kemp Allen and Michael Marsha C
Bought by
Michael Kemp Allen and Michael Marsha C
Home Financials for this Owner
Home Financials are based on the most recent Mortgage that was taken out on this home.
Original Mortgage
$141,000
Interest Rate
7.02%
Purchase Details
Closed on
Mar 30, 2000
Sold by
Smith Johnny L Leslie P
Bought by
Michael Kemp Allen and Cope Marsha C
Home Financials for this Owner
Home Financials are based on the most recent Mortgage that was taken out on this home.
Original Mortgage
$138,700
Interest Rate
8.38%
Create a Home Valuation Report for This Property
The Home Valuation Report is an in-depth analysis detailing your home's value as well as a comparison with similar homes in the area
Home Values in the Area
Average Home Value in this Area
Purchase History
| Date | Buyer | Sale Price | Title Company |
|---|---|---|---|
| Brunner Cory | -- | Servicelink | |
| Michael Kemp Allen | -- | -- | |
| Michael Kemp Allen | $146,000 | -- |
Source: Public Records
Mortgage History
| Date | Status | Borrower | Loan Amount |
|---|---|---|---|
| Open | Brunner Cory | $176,000 | |
| Closed | Michael Kemp Allen | $141,000 | |
| Closed | Michael Kemp Allen | $138,700 |
Source: Public Records
Tax History Compared to Growth
Tax History
| Year | Tax Paid | Tax Assessment Tax Assessment Total Assessment is a certain percentage of the fair market value that is determined by local assessors to be the total taxable value of land and additions on the property. | Land | Improvement |
|---|---|---|---|---|
| 2025 | $3,726 | $342,130 | $28,500 | $313,630 |
| 2024 | $3,726 | $342,130 | $28,500 | $313,630 |
| 2023 | $3,763 | $342,130 | $28,500 | $313,630 |
| 2022 | $2,825 | $209,270 | $22,000 | $187,270 |
| 2021 | $2,867 | $209,270 | $22,000 | $187,270 |
| 2019 | $2,888 | $209,270 | $22,000 | $187,270 |
| 2018 | $2,102 | $149,078 | $24,000 | $125,078 |
| 2017 | $2,061 | $149,078 | $24,000 | $125,078 |
| 2016 | $2,061 | $146,194 | $0 | $0 |
| 2014 | $2,128 | $150,897 | $30,000 | $120,897 |
Source: Public Records
Map
Nearby Homes
- 144 Walking Horse Run
- 502 Short St
- 118 Durham Rd
- 310 S Main St
- Lot 1 Derr St
- 102 Wingate Dr
- 105 Wingate Dr
- 143 W College St
- 2629 Dallas Stanley Hwy
- 2611 Dallas Stanley Hwy
- 3229 Bozeman Ct
- 3242 Bozeman Ct
- 5023 Dogwood Ln
- 437 Valley St
- 211 General Stonewall Jackson St
- 315 2nd St
- 201 Valley St
- 500 3rd St
- 000 N Main St
- 520 Summerow Rd
- 126 Walking Horse Run
- 130 Walking Horse Run
- 710 Mcdowell Place
- 124 Walking Horse Run
- 132 Walking Horse Run
- 129 Walking Horse Run
- 123 Walking Horse Run
- 122 Walking Horse Run
- 134 Walking Horse Run
- 135 Walking Horse Run
- 525 Short St
- 121 Walking Horse Run
- 120 Walking Horse Run
- 141 Walking Horse Run
- 119 Walking Horse Run
- 136 Walking Horse Run
- 700 Mcdowell Place
- 513 Short St
- 143 Walking Horse Run
- 118 Walking Horse Run